Microsoft Excel
Microsoft Excel. Intermediate Level. Today’s Agenda. Intro Formulas Graphs More Information & Practice Q & A. Introduction to Excel. Spreadsheets are often used to: Perform basic mathematical operations Find values such as profit or loss

Microsoft Excel
E N D
Presentation Transcript
Microsoft Excel Intermediate Level
Today’s Agenda • Intro • Formulas • Graphs • More Information & Practice • Q & A
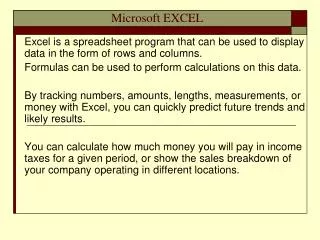
Introduction to Excel • Spreadsheets are often used to: • Perform basic mathematical operations • Find values such as profit or loss • Find the average, maximum, or minimum values in a specified range • Graph or chart data to assist users in identifying data trends • Sort and filter data to find specific information
Formulas • Formulas are the real workhorses of an Excel worksheet • If you set up a formula properly, it computes the answer when you enter it into a cell • From then on, it keeps itself up to date, recalculating the results whenever you change any of the values that the formula uses • All formulas begin with the = sign
Formulas • Addition • Select the cell you would like this information to be in. Type =, then select or type the first cell, followed by the + symbol, and then type or select the next cell you want to add. Press Enter • i.e. =A2+B2
Formulas • Adding • If you are adding consecutive numbers in a column or row, you can use the SUM formula. Type =SUM, and then the range you would like to add in parenthesis (you can type or select the range with your mouse). • i.e. =SUM(C2:C4)
Formulas • Subtraction • Select the cell you would like this information to be in. Type =, then select or type the first cell, followed by the – symbol, and then type or select the next cell. Press Enter • i.e. =A2-B2
Formulas • Multiplication • Select the cell you would like this information to be in. Type =, then select or type the first cell, followed by the * symbol, and then type or select the next cell. Press Enter • i.e. =A2*B2
Formulas • Division • Select the cell you would like this information to be in. Type =, then select or type the first cell, followed by the / symbol, and then type or select the next cell. Press Enter • i.e. =A2/B2
Graphs • Charts and graphs are a great way of representing your data • Excel offers almost every chart type and makes it easier to draw them so that your data can quickly be understood • Examples (Link will not work outside of presentation)
More Information and Practice • Microsoft Office • Overview Tutorial & Practice • Valencia Edge (Atlas) • Self-Paced Tutorial • Instructor Led Courses End
Q & A • Any Questions? End