Download
1 / 44
440 likes | 475 Views
This document presents the methodology and assumptions underlying the 5th Plan's conservation goals, derived from the integrated resource planning process. It analyzes the cost and risk of conservation portfolios across various future scenarios, incorporating considerations such as hedge benefits, lost and non-lost opportunities. The plan emphasizes leveraging conservation and renewable resources to meet load growth and adapt to changing market conditions. The analysis includes supply curves for coal, gas, and wind resources, showcasing the potential for cost-effective resource development. Furthermore, it explores scenario-based portfolio planning and trade-offs between costs and risks, prioritizing efficient conservation deployment to reduce expenses and carbon emissions. The document also examines achievable conservation potential, screening criteria, and evidence from past projects to support the Council's forecast of conservation outcomes.

E N D
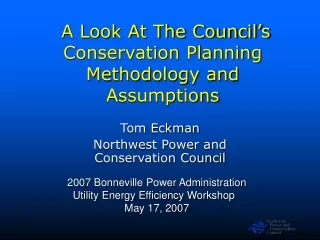
A Look At The Council’s Conservation Planning Methodology and Assumptions Tom Eckman Northwest Power and Conservation Council 2007 Bonneville Power Administration Utility Energy Efficiency Workshop May 17, 2007
Issue – Derivation of the 5th Plan’s Conservation Goals • Derived from Integrated Resource Planning Process • Analysis of Portfolio Cost and Risk across range of future conditions (750 futures tested) • Based on a range of future market prices • Accounts for “hedge” benefits of conservation • Non-lost opportunity: $5/MWh over forecast market prices • Lost-opportunity: $10/MWh over forecast market prices
5th Plan Relies on Conservation and Renewable Resources to Meet Load Growth* *Actual future conditions (gas prices, CO2 control, conservation accomplishments) will change resource development schedule and amounts
Uncertainties Impact Supply Curves(And Foretell the IRP Results) Resource potential for generic coal, gas & wind resources shown for typical unit size. Additional potential is available at comparable costs.
PNW Portfolio Planning – Scenario Analysis on Steroids Portfolio Analysis Model
Power Cost (NPV 2004 $M)-> Cost = Average Cost Across All Futures Cost for Future 2 Cost for Future 1 10000 12500 15000 17500 20000 22500 25000 27500 30000 32500 Analysis Test 1,000s of “Resource Plans” Against 750 Difference “Futures” Distribution of Cost for a Plan Number of Observations
Cost = Average Cost Across All Futures 10000 12500 15000 17500 20000 22500 25000 27500 30000 32500 Risk and Expected Cost Associated With A Plan Risk = Average Cost of “Worst Outcomes” (>90% threshold Likelihood (Probability) Power Cost (NPV 2004 $M)->
Plans Along the Efficient Frontier Permit Trade-Offs of Costs Against Risk Least Cost Least Risk
A C B D Efficient Frontier Background
The Plan Calls for Accelerating Conservation Development Because it Reduces Cost & Risk
The Plan Calls for Accelerating Conservation Development Because Reduces Carbon Dioxide Emissions
Timing Matters –Three Conservation Deployment Schedules Tested
Annual Achievable Conservation DeployedFifth Power Plan (Mean Deployment Schedule)
Issue: How Much is Achievable? • How much of the identified conservation potential: • Can we expect to ‘achieve’ • Over what time frame?
Findings • Empirical evidence supports Council’s forecast of achievable conservation potential • Council’s assumed near-term achievable acquisition rates are well supported and may be conservative
Council Conservation Methodology • Regional Act requires that resources are included in the plan if they are available: • ‘at an estimated incremental system cost no greater than that of the least-cost similarly reliable and available alternative’ • This Establishes Three Screening Filters • Technically Feasible • Economically Feasible • Achievable Potential
Achievable Potential ConstraintsFifth Power Plan • Non-Lost Opportunity • Maximum of 120 Average Megawatts/year • 85% of Economically Achievable over 20 years • Lost-Opportunity • 15% of Economically Achievable Savings in first year increasing to 85% by 12-years • About 65% over 20 years • About 50% over 10 years
What Evidence Do We Have? • Hood River Conservation Project • Performance relative to 1983 Plan expectations • Annual BPA & Utility Program Performance
Evidence: Hood River • Hood River Conservation Project • 1982-84 experiment in Hood River County • Try to weatherize all electric-heated homes • Measures installed at no cost to participants • Result: 85% Achieved • 85% of Technically Feasible Residential Weatherization Savings Achieved Over 2 years
Evidence: Performance Relative to 1983 Plan Expectations • New Residential and Commercial Construction (Model Conservation Standards) • Residential Appliances • Residential Water Heating • Commercial Lighting • Commercial HVAC Equipment • Irrigation (kWh/acre) • Industrial
New Buildings & EquipmentCompare 1983 MCS to what Happened • 1983 Model Conservation Standards • 1983 MCS represent 1983 expectations for new buildings & equipment • Compare 1983 MCS to historic: • Building codes • Appliance Efficiency Standards • Market Penetration
Lost-OpportunityResidential New Construction Council Goal 40% Improvement by 2002(85% of 40% = 34%)
Regional Average Annual Space Heating Use of New Single Family Homes Constructed Between 1983 and 2002
1983 Plan Forecast “0” Market Share of Energy Efficient Manufactured Housing
Average Energy Use of New Refrigerators 1983 Plan Baseline 1983 Plan Achievable by 2002 Actual 2002 Use
Average Energy Use of New Freezers 1983 Plan Baseline 1983 Plan Achievable by 2002 Actual 2002 Use
Average Energy Use of New Dishwashers 1983 Plan Baseline 1983 Plan Achievable by 2002 Actual 2002 Use
Average Energy Use of New Clothes Washers 1983 Plan Baseline 1983 Plan Achievable by 2002 Actual 2002 Use
Industrial Sector Achievable Potential • 1983 Council’s forecast of achievable conservation potential was equivalent to about 6 percent of non-DSI industrial electric loads • Motors comprise approximately 60 percent of industrial energy use • Federal minimum efficiency standards required 3 - 10 % improvement over 1983 efficiency levels for covered sizes
Other Documented Industrial Sector Efficiency Improvements • 20 to 30 % improvement in multiple cold-storage facilities • 15 to 30 percent improvements in compressed air systems for many plants across different industries • 50 percent in improvement in lighting in manufacturing spaces with high ceilings; and, • industry-specific process changes in the range of 20 percent improvement.
Ramp Rate Constraints Year-over-Year Change in Conservation Acquisitions Are Not Limiting
Why the 1983 “Achievable Potential” Forecast Was Important • In 1983 lead times for construction of new generation (coal & nuclear) were 12-15 years • Average resource size ~ 1000 MW • Therefore, if conservation resources were to offset the construction of new generation the Council needed to forecast “achievable savings” 12-15 years out • Even if successful, “options” would only defer construction lead time by 5-7 years
Why It’s Less Important Today • Lead time for new generating resources is 2-5 years • Average resource size ~ 250 – 350 MW • Ability to expedite (or delay) construction now greater • Issue is “near-term” ramp rate, rather than long term “maximum achievable”
Lack of Sustained Acquisition Program Activity Precludes Direct Comparison With 1983 Plan Forecast of Achievable Potential