Download
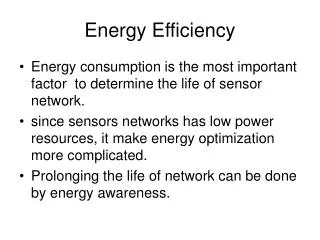
1 / 10
100 likes | 188 Views
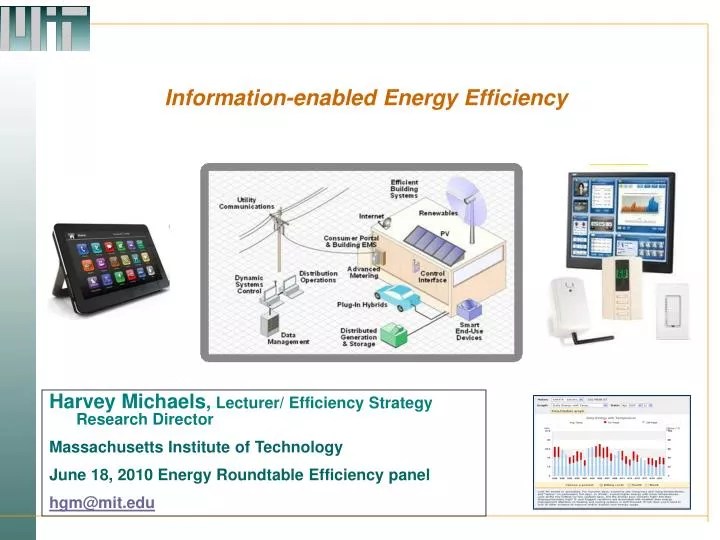
Information-enabled Energy Efficiency. Harvey Michaels , Lecturer/ Efficiency Strategy Research Director Massachusetts Institute of Technology June 18, 2010 Energy Roundtable Efficiency panel hgm@mit.edu. 80% below 1990 means: Reduce US Carbon pp from 5.5 tons/yr to < 1 ton/yr.

E N D
Information-enabled Energy Efficiency Harvey Michaels, Lecturer/ Efficiency Strategy Research Director Massachusetts Institute of Technology June 18, 2010 Energy Roundtable Efficiency panel hgm@mit.edu
80% below 1990 means:Reduce US Carbon pp from 5.5 tons/yr to < 1 ton/yr ENORMOUS EFFORT: • Capture all carbon from all coal plants (to date 0). • Triple coal and gas plants, also with all carbon captured. • 2/3 of all cars/trucks all-electric, rest adv. biofuels. • In units of 1000 MW (a typical nuke) by 2050 we need: • 1200 wind (last year 8) • 1400 solar (last year .3) • 500 nuclear (last 20 years 0) LAY-UP: Improve energy efficiency by 3% per year.
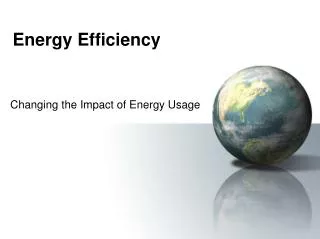
How will we Enable Energy Efficiency? US Buildings consume 71% of all electricity, 55% of all natural gas • 30% efficiency achievable by 2030 with 3 Deployment options: • Public funding models, incl. utilities: carrots • Codes and Standards: sticks • Data and intelligence-driven : information Transforming the nation’s consumers: good energy decisions (ie lower discount rates) change everything.
Smart Grid/AMI Granular Energy Data: - energy diagnostics, feedback, control Behavior impacts of smart grid-based information options may be as high as 30%: • Daily • End-use • Carbon Footprint? • Collective Action? • Fault-detection • Thematic Control – make me green • Control Precision • Adaptive Control Strategies
Only at the very beginning of adding inference/diagnostics to the Energy Internet
Opt in Indiv. (Total) 6.8% (0.5%) 11.0% (0.85%) 7.0% (0.55%) 14.0% (1.15%) Opt Out Indiv. (Total) 5.6% (4.5%) 7.0% (5.65%) 14.0% (11.25%) Meta-Review of Utility Feedback Programs • Savings Results by Program Type • Erhardt-Martinez, Donnelly, & Laitner 2010 (Forthcoming)
Consumer-responsive Architecture = Providing consumers with energy diagnostics, feedback, control refers to systems for optimizing consumers’ end-use needs (especially air conditioning, heat, hot water) • based on weather, schedules, and time differentiated costs. Time-differentiated rates are more fair, and some would argue inevitable. Customer Responsive Systems work 24/7, • providing efficiency as well as peak demand response.
Consumer-Controlled, Public Network Architecture: Device Workspace Consumer-side Utility’s Web Workspace MDM CRM Utility-side
Key Hypothesis:Utilities create the enabling conditions for market-based systems • To accomplish this,utilities, regulators should focus on: • consumer-centric architectures for appliance control, • Open and public architecture for AMI communication, • Encouraging a broad ecosystem of content providers, including utilities. • 2013 – How will efficiency look – when the politics change? • Smart meters and dynamic pricing – will we move forward? • The nation’s consumers – will we innovate, educate, and support good energy decisions? (ie lower discount rates) • We can do this – but can we do it in time?