Download
1 / 2
20 likes | 132 Views
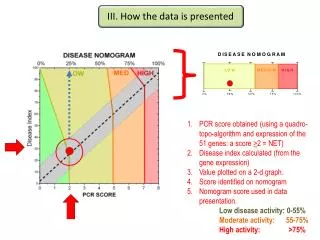
This article outlines how the PCR score is derived using a quadro-topo algorithm based on the expression levels of 51 specific genes. A score greater than 2 is considered indicative of NET. The disease index, calculated from gene expression, is visually represented on a 2D graph. Scores are classified into low (0-55%), moderate (55-75%), and high (>75%) disease activity. Additionally, it discusses potential outcomes from test results, including baseline levels and variations across multiple tests, providing insights into disease progression.

E N D
III. How the data is presented PCR score obtained (using a quadro-topo-algorithm and expression of the 51 genes: a score >2 = NET) Disease index calculated (from the gene expression) Value plotted on a 2-d graph. Score identified on nomogram Nomogram score used in data presentation. Low disease activity: 0-55% Moderate activity: 55-75% High activity: >75%
III. Your Test Results Possibilities: Test 1- base line level 3 1 Test2: level decrease 2 Test 3: level increase