Download

1 / 8
80 likes | 177 Views
Explore dropout rates in LAUSD schools and map poverty concentrations using GIS to identify areas needing violence prevention policies for students. Learn about demographics, violence hotspots, and student needs.

E N D
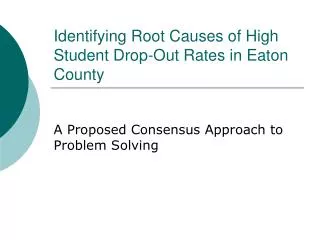
Drop out rates in LAUSD Schools Intro to GIS, Fall 2009
What I DID NOT do Get crime rates Successfully teach myself to georeference an image using control points Keep my sanity
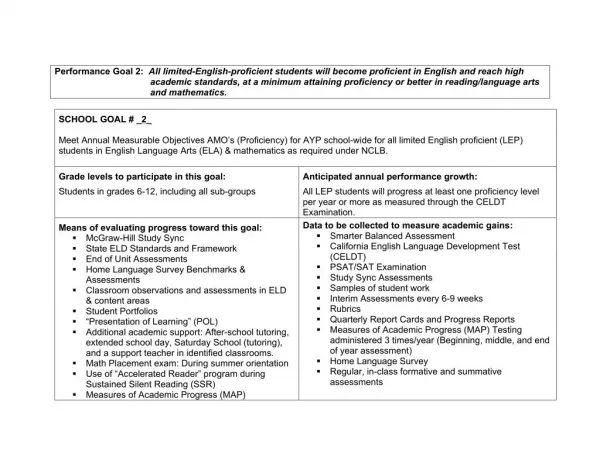
Low income areas are concentrated: • East LA • South LA • The Valley Aggregated field creation: (public assistance+SSI) / Tot. Pop. Map by: Jessica Nolan Map by: Jessica Nolan
Map by: Jessica Nolan Poverty is centralized in the same areas that people receive the most public assistance. • East LA • South LA • The Valley
FINALPOLICY QUESTION: What district-wide, violence prevention policy can LAUSD middle and high schools utilize to help educate students on the skills needed to prevent violence? FIRST WE MUST KNOW • What are the demographics of LAUSD schools? • Where is violence centralized in LA County? • What are the needs of LAUSD students?
Skills • Inset Map: LAUSD Map • Point graduated Symbol: displayed the number of drop outs in LAUSD high schools • Aggregating attribute fields: adding together public assistance and SSI and then dividing by the total pop. Per census tract. • Attribute Subset Selections: selected LAUSD schools from all LA County Schools, selected major Interstates from an LA County roads shape file • Create Indices: Calculated percent of people that receive public assistance • Attribute sub-set selection: Selected City of LA from LA County Places for all maps. Selected interstates from LA County roads for all maps. • Geocoding: Created address locator for LAUSD High Schools and Middle Schools. • Geoprocessing: Clipping: Clipped LAUSD from County of LA school districts, clipped interstates to LA County, Clipped LA County from CA Counties,