Slide Note
0 likes | 7 Views
The presentation to the Budget Committee and Provincial Treasury highlights the third quarter performance outcomes in the Western Cape for the 2023/24 financial year. Key points include a decline in GDP, decrease in unemployment, increase in violent crime, and various departmental and public entity performance indicators. The report also covers financial outcomes, showing expenditure trends and projected over-spending mainly in the Department of Health and Wellness.

E N D
THIRD QUARTER PERFORMANCE & FINANCIAL OUTCOMES FOR THE 2023/24 FINANCIAL YEAR Presentation to Budget Committee Provincial Treasury & Dept of the Premier 7 March 2024
Socio-economic picture through PSIP outcome indicators Some positive signs Jobs Safety Well-being • GDP for the WC declined by 0.36% during Q3 of 2023 • Number of people unemployed decreased by 0.7% • Official unemployment rate stood at 20.2% • Increase in violent crime: homicides in the WC increasing by 8% y-o-y from Q3 2022/23 • 13 metro priority areas recorded 7.9% increase in homicides • 13 metro priority areas accounted for 49% of all homicides in the Province • 4% increase in the number of sexual assault presentations at public hospitals compared to last year • The HIV-positive rate for 15–24-year- olds for the first quarter was 1.44% • 16.5% of children born in government facilities weighed under 2500g Source: PSIP Provincial Performance & Financial Outcomes Q3 2023/24 3
Overview of quarter 3 delivery trends for performance indicators Our formal targets do not correlate strongly with either socio-economic conditions or with our expenditures Overview of provincial performance Overview of departmental APP performance Overview of public entity APP performance Overall performance for Q3 = 86% (439 of 513 targets achieved) • Achieved = 372 of 429 targets (87%) None of the 13 departments achieved 100% of all their targets. • Partially achieved = 40 targets (9%) • Not achieved = 17 targets (4%) • Achieved = 67 of 84 targets (80%) Five out of 10 public entities achieved 100% of all their targets. • Partially achieved = 12 targets (or 14%) • Not achieved = 5 targets (or 6%) Performance Trends 2023/24: Overall performance for Q1 = 74% (350 of 470 targets achieved) Overall performance for Q2 = 77% (408 of 527 targets achieved) Departmental clusters performance: Public entities clusters performance: • Governance Cluster = 92% • Social Cluster • Economic Cluster • Governance Cluster = 82% • Social Cluster • Economic Cluster = 89% = 79% = 78% = 80% Provincial Performance & Financial Outcomes Q3 2023/24 4
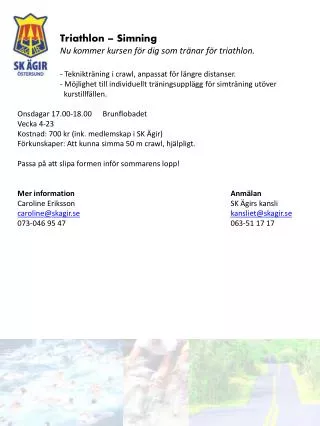
Departmental Performance Q3 2023/24 Nine (9) departments achieved more than or equal to (≥) the WCG average of 87%: DotP (89%); PT (98%); DLG (87%); DOHW (89%); DSD (87%); DPOCS (95%); DCAS (89%); DEDAT (88%)and WCMD (87%). Four (4) departments achieved less than (<) the WCG average of 87%: WCED (71%); DOI (45%) ; DOA (86%) and DEA&DP (85%). Provincial Performance & Financial Outcomes Q3 2023/24 5
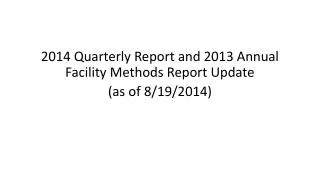
Public Entity Performance Q3 2023/24 Seven (7) public entities achieved more than or equal to (≥) the WCG average of 80%: WCGRB (82%); HWC (100%); WCLC (100%);WCCC(100%); WESGRO (80%); CapeNature (100%) and Atlantis SEZ (100%) Three (3) public entities achieved less than (<) the WCG average of 80%: WCLA (70%); Casidra (69%) and Freeport Saldanha IDZ (67%) Provincial Performance & Financial Outcomes Q3 2023/24 6
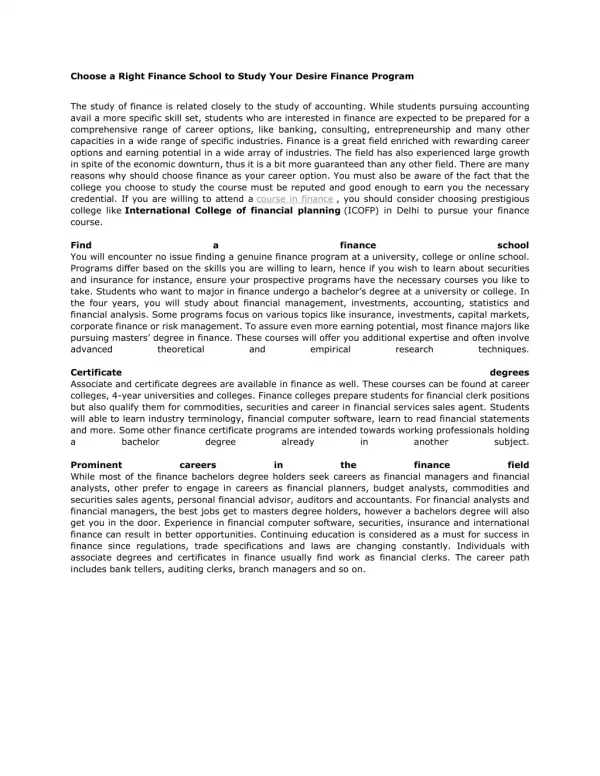
Average performance Q1 to Q3 – Provincial Departments 100 90 80 % of target achieved 70 60 50 40 30 20 10 0 DEA&D P 69 67 85 WCG Avg 76 78 87 DotP PT DLG WCED DOHW DSD DPOCS DCAS DOA DEDAT DOI WCMD %of Targets Achieved_Q1 %of Targets Achieved_Q2 %of Targets Achieved_Q3 94 94 89 97 93 98 75 84 87 67 33 71 58 61 89 79 87 87 96 96 95 87 75 89 82 89 86 55 71 88 28 33 45 80 87 87 Provincial Performance & Financial Outcomes Q3 2023/24 7
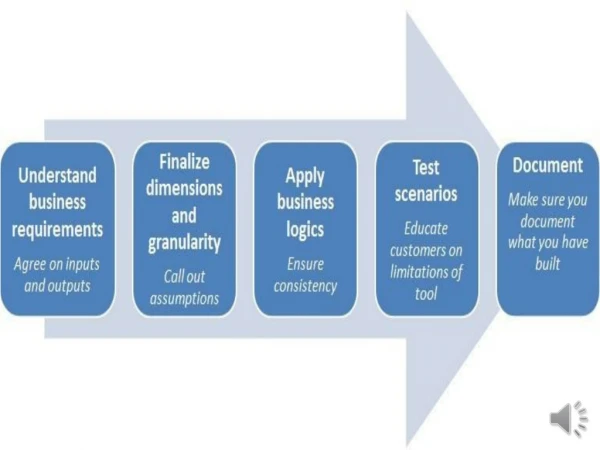
Average performance Q1 to Q3 – Provincial Public Entities 100 90 % of target achieved 80 70 60 50 40 30 20 10 0 Freeport Saldanha 67 71 67 CapeNat ure 100 86 100 Atlantis SEZ SOC 100 100 100 WCGRB WCLA HWC WCLC WCCC Wesgro Casidra WCG Avg %of Targets Achieved_Q1 %of Targets Achieved_Q2 %of Targets Achieved_Q3 88 75 82 53 58 70 75 100 100 100 100 100 60 80 80 40 65 69 68 74 80 100 100 Provincial Performance & Financial Outcomes Q3 2023/24 8
Provincial Expenditure as at 31 December 2023 Budget – 73.5% or R60.180 billion of R81.830 billion budget spent. Projected year-end over spending of R94.686 million – mainly related to Health and Wellness indicating overspending on G&S of R130 million. Developments after 31/12/2023 - HSDG re-allocation of WC funds to Limpopo of R250 million Provincial Performance & Financial Outcomes Q3 2023/24 10
Provincial Expenditure as at 31 December 2023 Spending amounted R60.180 billion or 73.5% of the R81.831 billion adjusted estimate for the 2023/24 financial year. The Province projected a net over spending for year-end of R94.686 million, mainly related to the Department of Health and Wellness due to pressures within Goods and Services (R130.508 million) as a result of as a result of: the full commissioning of non-COVID-19 services (including addressing the backlog in theatre lists), general increase in patient numbers and patient acuity, increasing medical inflation being above CPI rates, increased municipal services tariffs, as well as rising fuel prices that impact the prices of most commodities; and • the risk in Good and Services (G&S) remains real, due to the partial funding of the 2023 wage agreement which necessitated the reprioritisation of possible in-year savings on Compensation of Employees (due to delays in filling of posts) to cover the shortfall in the wage agreement funding received. • previous years’, CoE slow down would have been utilised to off-set G&S pressures • Provincial Performance & Financial Outcomes Q3 2023/24 11
Spending on Compensation of Employees as at 31 December 2023 Net movement 1 266 mainly related to: Education 1 254 posts – mainly due to the increase in appointment of Educators (949) (temporary educators as well as contracted public service personnel of 351 related to graduate and the Premiers Advancement Youth (PAY) programme interns). Health & Wellness 117 posts - mainly related to the appointment of nursing staff Mobility 658 posts - shift of staff from Infrastructure as part of management arrangement as well as the appointment of trainee traffic officers Provincial Performance & Financial Outcomes Q3 2023/24 12
Spending on Public Entities as at 31 December 2023 Public Entities recorded total spending of R630.896 million or 68.6% of the R920.043 million adjusted budget. Casidra: The Entity’s projected overspending amounts to R1.143 mainly due to salary backlogs and payments for capital assets. The Department of Agriculture have made the funds available that will be allocated to Compensation of Employees in the fourth quarter. WCLA: Savings in advertising costs and audit fees Provincial Performance & Financial Outcomes Q3 2023/24 13
Spending on Infrastructure as at 31 December 2023 Note: *As from 1 April 2023, the Department of Infrastructure was created and consists of Programme 2: Public Works Infrastructure, Programme 3: Transport Infrastructure (Roads), and Programme 4 Human Settlements. Main underspending: Infrastructure (Transport) Due to the flood damage caused during June and September 2023. The Programme needed to reprioritize those major roads which were impacted. During the winter months, regravel and reseal of roads are delayed, thus (based on past performance) it is predicted to pick-up in the summer months. Infrastructure (Human Settlements) Continued threat of the construction mafia and extortion through acts of violent threats, shootings and intimidation on several project sites lead to stoppages. Illegal land invasions on land earmarked for housing development has had a detrimental impact on the Programmes spending. Violent community protests by non-qualifying beneficiaries. Provincial Performance & Financial Outcomes Q3 2023/24 14
Provincial own Revenue as at 31 December 2023 Provincial own receipts collection – R758.495 million or 119.3% of adjusted budget. Main contributors - Departments of Health and Wellness, Mobility and Infrastructure. Other collections MVL tax receipts – increased collection due to the growth in the motor vehicle population. Gambling taxes exceeding collection for same period last year where an over-collection of R166.479 million is expected at the end of the 2023/24 financial year. Provincial Performance & Financial Outcomes Q3 2023/24 15
Overview of delivery trends DoTP 48 mobile services were made available to citizens to improve access to government services. • Governance The Demand Side Management (DSM) Municipal Advisor project has conducted follow-up engagements with multiple municipalities. A Service Level Agreement (SLA) for the Triple Helix contract Work in line with the Western Cape Infrastructure Framework 2050 (WCIF2050) is in the pipeline. The Western Cape Government Broadband 2.0 Project was set to undergo a key review by the SITA Executive Bid Adjudication Committee on December 7. • G4J • • G4J PT 25 bursaries were awarded through the Internal and External Bursary Programmes • DPOCS One social crime prevention programme implemented to promote community participation in crime prevention. 55 NHW structures were accredited, increasing their capacity to contribute to safety of WC communities. 39 accredited NHW structures were trained. 33 LEAP-integrated operations in support of Rural Safety and K9-integrated operations. 5 Operations were conducted at Overstrand, 13 in Mosselbay and 15 Operations in Swartland. 7 LEAP operational meetings held: 2 Steercom meetings, 1 Redeployment Model meeting, 3 LEAP Station Branding meetings and 1 Premier’s Delft event. 2 275 arrests conducted by LEAP officers targeting drivers of crime, with drug-related arrests remaining the main type of arrests. In addition, LEAP officers confiscated 66 firearms. 13 Law Enforcement Technical Task Teams (LETATs) have been established by POCS. • • • • • • • 272 youth were supported through the Chrysalis Academy, to contribute to the skills development of youth in the Western Cape. • G4J Provincial Performance & Financial Outcomes Q3 2023/24 18
Overview of delivery trends WCED Three (3) public schools were assessed for suitability to offer Grade R education to increase accessibility. 90 SROs were placed at schools in hotspots, with at least 2 SROs in 45 schools. 95 ECD centres across the Province continue to be supported. 1 491 Individual Support Plans and reports under the Learning Initiative have been completed. Home Language interventions linked to the WC Reading strategy were rolled out. All Afrikaans HL classes received decodable graded readers. Mathematics interventions aligned to the Provincial Improvement Plan include additional time allocated to group teaching in Mathematics and the strengthening of Mathematics through Maths Curriculum Online, diagnostic assessments and the Mental Starters assessment programme. The provisioning of Maths kits to selected schools has also been rolled out. Five (5) schools in high-priority areas were provided with high-security perimeter fencing. • • • • • • • DoHW Patient Safety Incident (PSI) cases were closed in different hospitals as follows: • District Health System 96.48% • Specialised Hospitals 99.1% • Central Hospitals 99.1% • Tertiary Hospitals 100% 70.76% Severity assessment code (SAC) 1 Incidents were reported in the district health system within the 24 hours rate The VPU coordinators have been appointed. HECTIS has been rolled out to a further 2 health service points 40 safety data reports were sent to SAPS and CoCT to inform operational deployment. 62.5% mothers received postnatal care within 6 days after delivery. 11.7% Delivery 10 - 19 years in primary health facilities were performed. 53.4% of women were protected against pregnancy by using modern contraceptive methods, including sterilisations. 69.1% of Children 1 year (12 months) received measles 2nd dose, as a proportion of the 1-year population. • • • • • • • • • Provincial Performance & Financial Outcomes Q3 2023/24 19
Overview of delivery trends DoHW 46.3% of Children aged 12 - 59 months received Vitamin A 200,000 units, every six months as a proportion of population aged 12 - 59 months. 61.32% of ART children remained in care at 12 months. 41.2% of ART child viral load suppressed rate under 50, done at 12 months. 53.1% of ART adult remain in care rate (12 months), as a proportion of ART adult start minus cumulative transfer out. 69.6% of adult viral load suppressed rate (at 12 months) under 50, as a proportion of ART adult viral load done. 77.98% of TB clients successfully completed treatment as a proportion of all those who started with DS-TB treatment. Complaints resolved within 25 working days rate (including public holidays) as a proportion of all complaints resolved in Hospitals for: • District Hospitals 96.3% • Regional Hospitals 98.5% • Specialised Hospitals 95.8% • Central Hospitals 93.2% • Tertiary Hospitals 98.2% Response time for EMS P1 calls in urban locations was 21% with response time measured under 15 minutes. Response time for EMS P1 calls in urban locations was 48.7% with response time measured under 30 minutes. Response time for EMS P1 calls in rural locations was 79.3% with response time measured under 60 minutes. Response time for EMS incident mission time for all emergencies was 49.8% with response time measured under 120 minutes. 16.5% of infants born alive in Regional Hospitals were under 2,500g. Severity assessment code (SAC) 1 Incidents reported within 24 hours rate as a proportion of Severity assessment code (SAC) 1 Incident reported for: • Regional Hospitals 86.11% • Specialised Hospitals 69.3% • Central Hospitals 30.8% 97.0% Patient Safety Incident (PSI) cases were closed in Regional Hospitals • • • • • • • • • • • • • • Provincial Performance & Financial Outcomes Q3 2023/24 20
Overview of delivery trends DSD 2,191 adults in conflict with the law were referred by the courts to an appropriate diversion programme. 1,179 children in conflict with the law were assessed. 1,036 children at risk were identified, assessed, and followed up for interventions by DSD social workers. 484 victims of crime and violence were accessed for access to services in funded Victim Empowerment Programme shelters, services and a safe environment. 168 subsidised beds in funded inpatient treatment centres were provided. 1 544 adults in conflict with the law completed diversion programmes 237 children in conflict with the law completed diversion programmes. 523 DSD social service professionals are deployed in ABT areas. 2 635 service users completed substance abuse treatment programmes. 6 171 victims of gender-based violence accessed psychosocial support services. 806 EPWP work opportunities were created to remunerate people with a daily stipend payment, job skills and life skills in order to reduce poverty. 3 268 youth participating in skills development programmes were recorded. 4,756 Older Persons benefitted from subsidised beds at NPO residential care facilities. 11,968 Older Persons benefitted from subsidies transferred to community-based care and support services. 680 beds were subsidised to assist with independent living facilities for Older Persons. 1,657 Persons with Disabilities benefited from subsidised beds at funded NPO residential care facilities. 1 053 Persons with Disabilities (children and adults) live in government-owned residential facilities. 2,510 Persons with Disabilities benefitted from protective workshops. 1 073 household undue hardship cases were identified and assessed. 319 disaster cases (households) were assessed. 189 adult family members were reunited with their families. 6 983 families benefitted from participating in family preservation and support services. 66 children were reunified with their families or alternative caregivers. 958 parents and caregivers completed parent education and other family support programmes. 73 organisations were funded to provide After-school care (ASC) support 14 722 people provided with meals. 2 398 subsidised beds in shelters for homeless adults were provided. • • • • • • • • • • • • • • • • • • • • • • • • • G4J Provincial Performance & Financial Outcomes Q3 2023/24 21
Overview of delivery trends WCMD 1,073 speed operations were conducted. 149,220 vehicles were weighed. 1,136 drunken driving operations were conducted. 474,171 vehicles were stopped and checked, ensuring compliance with traffic regulations and other applicable legislation. 11 pedestrian operations were conducted at identified high-risk areas. 124 road safety awareness interventions were conducted. 82 schools benefited from Road safety education programmes. 2,075 traffic law enforcement operations were conducted. 403 targeted operations conducted: o 69 305 vehicles stopped and checked, o 301 DUI arrests, o 2 Speed arrests, o 37 Reckless and Negligent driving arrests, o 48 False Documentation arrests, o 7 Bribery arrests, o 1 possession of stolen vehicle arrest, o 4 undocumented persons arrests, o 2 possession of illegal substance arrests (Khat), and o 22 other arrests. 98 compliance inspections were conducted, to assess compliance with authorisations/permits issued in terms of pollution, waste, air quality, impact assessment, protected areas, biodiversity, and integrated coastal management requirements. 100% waste management licenses were finalised within the legislated timeframes. 14 environment capacity building activities were conducted. The Berg/Breede Riparian Rehabilitation Project has been successfully navigating the challenges posed by heavy rainfall. The Wetlands Valuation in Breede River Catchment project has compiled a draft report and model. • • • • • • • • • DEA&DP • G4J • • • • Provincial Performance & Financial Outcomes Q3 2023/24 22
Overview of delivery trends DEA&DP The RSEP programme is implemented in 4 towns in the Western Cape with a Safety and Dignity component. 1,983 kilometres of gravel roads were bladed to improve the safety and serviceability of gravel roads • DoI 523 work opportunities were created by Provincial Public Works Two (2) new construction projects were completed for users/ user departments to improve service delivery. 2,784 work opportunities were created encompassing EPWP-aligned principles in the Transport Sector. 1,591 youths were employed (18 - 35) on EPWP projects. 969 women were employed on EPWP Projects in the transport sector. Three (3) persons with a disability were employed on EPWP projects in the transport sector. 3,51 kilometres of gravel roads were re-gravelled . 292 households received subsidies through FLISP. 657 Breaking New Grounds (BNG) houses were delivered. 61 serviced sites were delivered. 63 beneficiaries earning between R0 – R3 500 per month were provided with subsidies through the Individual Subsidy (Non-Credit Linked) Programme. 520 homeowners benefited through the Enhanced Extended Discount Benefit Scheme (EEDBS) 62 pre-1994 title deeds were registered. 123 post-1994 title deeds were registered. 245 post 2014 title deeds were registered. 385 new title deeds were registered. 87 housing units were delivered under the Developer Driven Individual Subsidy Programme (DDISP). One (1) Social Housing project was endorsed for approval. The Wheeling Toolkit was presented to the CFO Forum on 5 December 2023. The Green Economy Ecosystem Support (GEES) held an inception meeting of 13 December 2023. A new Intervention Lead was nominated for Overcoming PFMA and MMFA Constraints project and four critical milestones for the project were identified. G4J Provincial Performance & Financial Outcomes Q3 2023/24 23
Overview of delivery trends 77 technical engineering activities were supported. 281 jobs for EPWP workers in support of the Green economy were created. Eight (8) farm management plans were supported l. Four (4) producers in the red meat commodity markets and one (1) producer in the grain commodity market were supported. Eight (8) black commercial farmers were supported. Nine (9) “farmer’s days” were facilitated. Three (3) smallholder producers were supported. Four (4) Research and Development (R&D) information packs were developed. 128 Students graduated with agricultural qualifications. 1,293 participants in skills development were trained to contribute to the sector. 1,107 households with agricultural food production initiatives were supported. 142 inspections on meat-producing outlets were conducted. 121 beneficiaries were assisted through the referral system. One (1) Western Cape Prestige Agri Awards engagement was conducted. Three (3) red tape reduction awareness interventions were conducted. 93 consumer education interventions were conducted. 1,298 beneficiaries through skills interventions which include “Training opportunities” and “Work placement”. BDO Advisory was appointed to conduct the Visa Reform Research Study and Economic Model. A prototype of the Port of Cape Town Container Logistics Planning Dashboard was presented to the Jobs Manco. The Export Competitiveness Enhancement Programme (ECEP) was re-advertised. The Green Hydrogen Development project strategy and roadmap report was completed. The Removing Constraints in Exchange Control and Intellectual Property project report was finalized. The WC has been selected as a potential site for South Africa's first technology sandbox focused on drones and UAVs, with Saldanha proposed as the preferred location. A service provider was appointed to benchmark South Africa's visa regime and model the economic impact of potential regulatory reforms relating to the Critical Skills Visa. The Growth through Experiential Learning and Jobs (Clothing and Textile) project has completed MoA. The Life Orientation: Career Focus - Career Clubs provincial launch was delivered. Onboarding of learners has taken place and stipends have been paid to date for the Improved Workplace Skills and Productivity Pathways project. • • • • DoA • • • • • • • • • • • • • • • G4J DEDAT • • • • • • • G4J Provincial Performance & Financial Outcomes Q3 2023/24 24
Overview of delivery trends 92 beneficiaries with tourism safety services were supported. • DEDAT 149 practitioners benefitted from capacity building opportunities to maximise opportunities presented by the arts. One (1) community conversation/ dialogue was implemented to foster social interaction and nation building on issues such as racism, discrimination, xenophobia and cultural intolerance at local level. 61 Arts and Culture organisations, individuals and companies were supported financially. Six (6) capacity projects were presented amongst youth to promote, preserve, and develop arts and culture to advance wellness within communities. One (1) cultural commission was supported to promote, preserve and develop arts and culture in the province. Nine (9) training programmes to public library staff were provided. 44 affiliated district sport federations were supported financially. 41 major events were supported to promote sport tourism. One (1) fitness and wellness programme was facilitated by gymnasium. Four (4) sport and recreation days were held for employees. Four (4) women and girls interventions were supported that promote sport and recreational activities. Two (2) intervention for persons with disabilities were supported to promote sport and recreational activities for persons with disabilities. Over 24,000 learners academically and/or behaviourally at risk are currently registered on the DCAS after-school programme. 229 libraries provided public Internet access. DCAS Provincial Performance & Financial Outcomes Q3 2023/24 25
Overview of delivery trends • One municipality was provided support in developing Disaster Risk Reduction measures in their IDPs to promote safety in the Western Cape • One Hazard Awareness Programme was held to promote safety in the Western Cape. • Weekly progress meetings held with Hessequa municipality to track the progress of the project to pilot renewable energy solutions in municipalities. • The Provision of Hydrogeological Services project had proposals evaluated and a recommendation was submitted to the Accounting Officer/Head of Department for further action. • A service provider has been appointed for the Buffeljags Dam future pipeline abstraction analysis under the Augmentation of water supply in the Western Cape project. • 350 000 service requests were processed through the Thusong Service centres. The Thusong Outreach was implemented in Haarlem, Uniondale, Vleiland, Matjiesfontein, Laingville and Paternoster. DLG G4J • A calendar of events to Position the Western Cape as Africa’s Hub of Venture Capital in Europe and Africa was curated. WESGRO G4J • Two (2) enterprise development initiative were supported to increase entrepreneurs and SMME owner’s knowledge of market opportunities and business acumen in Atlantis ASEZ G4J • Two (2) community integration initiative were supported to develop stakeholder engagement through effective communications and to attain buy-in from the community in Atlantis. 231 businesses through economic interventions were supported, all of which therefore sustain or increase employment. 76 people had access to economic opportunities and /or employability. • Freeport Saldanha • G4J Provincial Performance & Financial Outcomes Q3 2023/24 26
Overview of delivery trends 98% of permanent and secondary license applications were received by the Liquor Licensing Administration and forwarded to the Tribunal within prescribed timeframes. WCLA 100% of licensees meet the criteria in Section 64(1) of the Act to ensure all licenses qualifying for the non- automatic renewal process are subjected to the Section 64 process. 98% of permanent and secondary license applications were considered by the Liquor Licensing Tribunal within the prescribed time frames. 100% of all enforcement matters by the Liquor Licensing Tribunal within 60 days of referrals, were finalised. 50% of Liquor Licensing Tribunal fines were issued to ensure compliance. 99% of section 64 non-automatic renewal matters finalised by the Liquor Licensing Tribunal by 31 December to ensure that all section 64 non-automatic renewal applications are considered by the LLT within the current renewal period. 82% of valid licenses at the beginning of the financial year are inspected by the end of that financial year, ensuring compliance with liquor legislation as well as their license conditions. 96 joint law enforcement operations with other agencies were conducted, targeting licensed and unlicensed premises in defined areas. 96% of complaints received within two (2) months were finalised, ensuring cases of non-compliance are addressed timeously to develop a trust relationship with communities that should work closely with authorities to address alcohol-related harms. 693 inspections were conducted, focusing on under-age drinking and access to restricted areas to ensure licensed liquor outlets comply with the provisions of the Act. 99% of all new licensed premises were inspected within three (3) months after issuing of the license, ensuring new entrants are familiar with the conditions of their licenses and comply with the provisions of the Act and conditions of the license. 100% of licensed outlets within the ABT areas were inspected every quarter, focused on specific contraventions that leads to disorderly behaviour and/or prejudice public interest and improving compliance. Provincial Performance & Financial Outcomes Q3 2023/24 27


![[PDF] Free Download Neurofitness: A Brain Surgeon's Secrets to Boost Performance & Unleash Creativity Full](https://cdn5.slideserve.com/11106392/slide1-dt.jpg)