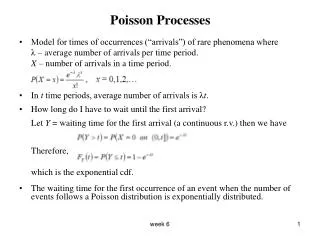
Understanding the Poisson Distribution: A Study of Coin Toss Outcomes
This document explores the characteristics and implications of the Poisson distribution, particularly in relation to the average total number of heads obtained from a series of coin tosses. It highlights the probability distribution for obtaining a specific number of heads, showcasing essential statistics like mean and variance. The visuals included are adapted from Wikipedia, illustrating the distribution plot effectively. This analysis is crucial for grasping the behavior of random events and lays the groundwork for statistical modeling in various applications.


Understanding the Poisson Distribution: A Study of Coin Toss Outcomes
E N D
Presentation Transcript
Poisson limit 0.4 H H H H H H H T T T T T T T T T T 0.3 . . . 0.2 0.1 T 0 5 10 15 20 Distribution plot adapted from (http://en.wikipedia.org/wiki/File:Poisson_pmf.svg), licensed by Wikipedia user Skbkekas under a CC-BY-3.0 license.
Poisson limit H H H H H H H T T T T T T ? ? ? ? ? ? ?
Poisson limit Average total number of heads Variance of total number of heads H H H H H H H T T T T T T T T T T T T T . . . H . . . T
Poisson limit Probability distribution for getting xtotal heads H H H H H H H T T T T T T T T T T T T T . . . H . . . T
Poisson limit Probability distribution for getting xtotal heads H H H H H H H T T T T T T T T T T T T T . . . H . . . T
Poisson limit 0.4 H H H H H H H T T T T T T T T T T 0.3 . . . 0.2 0.1 T 0 5 10 15 20 Distribution plot adapted from (http://en.wikipedia.org/wiki/File:Poisson_pmf.svg), licensed by Wikipedia user Skbkekas under a CC-BY-3.0 license.