Understanding Logarithmic Functions: Graphing, Properties, and Applications
In this lesson, we explore logarithmic functions and their graphical representation. Due to the vast range of numerical values, a standard scale may not suffice; hence, we introduce a logarithmic scale that adjusts to the exponent of the distance. We learn about the inverse relationship between exponential functions and logarithms, key logarithmic properties, and the Change of Base Theorem for different bases. Additionally, we solve logarithmic and exponential equations, including using logarithms for practical applications like calculating doubling time in inflation scenarios.

Understanding Logarithmic Functions: Graphing, Properties, and Applications
E N D
Presentation Transcript
Logarithmic Functions Lesson 2.5
How to Graph These Numbers? • Consider thevast rangeof the numbers
How to Graph These Numbers? • What's wrongwith thispicture?
How to Graph These Numbers? • What's wrongwith thispicture? We need a way toset a scale that fits all the data
How to Graph These Numbers? • The solution:Set the scaleto be the exponentof the distance This is called a logarithmic scale
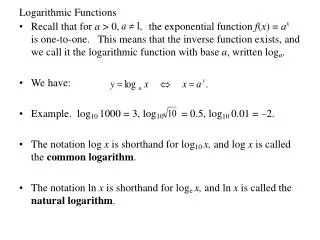
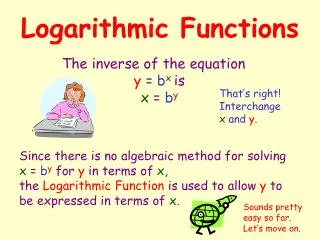
A New Function • Consider the exponential function y = 10x • Based on that function, declare a new function x = log10y • You should be able to see that these are inverse functions • In general • The log of a numberis an exponent
Note: if no base specified, default is base of 10 The Log Function • Try Theselog39 = ? log232 = ? log 0.01 = ?
Properties of Logarithms • Note box on page 105 of text • Most used properties
Change of Base Theorem • To find the log of a number for a base other than 10 or e … • Use • Where b can be any base • Typically 10 or e • Available on calculator Note new spreadsheet assignment on Blackboard
Change of Base Theorem • Create a function for your calculator • Definefunction • Try it • Verify
Solving Log Equations • Use definition of logarithm • Rewrite log equation as an exponential equation • Result x = 32
Solving Exponential Equations • Use property of logarithms • Consider • Isolate exponential expression • Take ln of both sides • Solve for x
Doubling Time • What if inflation is at the 5% rate … • How long until prices double? • Strategy • Divide through by P • Take log of both sides • Bring t out as coefficient • Solve for t
Assignment • Lesson 2.5 • Page 121 • Exercises 1 – 79 EOO