Logarithmic Functions
Learn about exponential & logarithmic functions, graphing, inverse relationships, key features, applications like population growth models & tree growth predictions.


Logarithmic Functions
E N D
Presentation Transcript
Review of exponential functions exponential function with base a: y = ax where a > 0 and a ≠1 When a > 1, the graph of y = ax has the following shape: When 0 < a < 1, the graph of y = ax has the following shape: In both cases, the graph passes through (0, 1) and (1, a).
Exponential functions For the function y = 3x, find the value of y when x = 4. y = 3x y = 34 substitute x = 4: y = 81 evaluate: Now can you find the value of x for the function y = 3x when y = 100, without using a graph? y = 3x 100 = 3x substitute y = 100: x = ? solve: When the value of x is not obvious, as in this case, the inverse of the exponential is required.
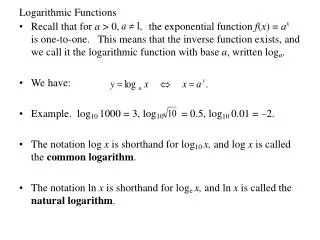
What is a logarithmic function? The inverse of addition is subtraction. The inverse of multiplication is division. The inverse of an exponential is called a logarithm (log). logarithmic function: if x = ay, then y = logax for a positive value of xand for a > 0, a ≠ 1 “logax” is read as “log base a of x.” The logarithm asks “to what power, y, is a raised to get x?” Can you explain why a ≠ 1 must be included in the definition of a logarithmic function?
The graph of a logarithmic function By thinking about the graphs of some inverse functions, e.g. f(x)= x + 1 and f–1(x) =x – 1, f(x) = 2x and f–1(x) =½x, sketch the graph of a logarithmic function. The graph of a function’s inverse is a reflection of the function in the line y = x. The graph of the logarithmic function is therefore a reflection of an exponential function in the line y = x. Discuss the key features of the graph of y = loga x.
Analyzing the logarithmic function y = loga x parent logarithmic function: vertical asymptotes: x = 0 horizontal asymptotes: none domain: (0, ∞) range: (–∞, ∞) roots: (1, 0) other key points: (a, 1) Explain why the curve always passes through the point (1, 0) for all values of a.
Population model Suppose that there is a single bacterium cell that breeds by multiplying by 10 every minute. Write a logarithmic function describing the number of minutes, t, it takes for the bacteria population to reach B. How long (to the nearest minute) until there are 8000 bacteria? write as exponential function: B = 10t if x = ay, then y = logax: t = logB (“log” implies base 10) substitute B = 8000: t = log8000 = 3.90 (nearest hundredth) It will therefore take 4 minutes.
The growth of a tree To celebrate Kim’s first birthday, her father planted a tree in the front yard of their home. Every two years he went out and recorded the height of the tree. The table below shows the tree’s height up to Kim’s 21st birthday. a) Using a graphing calculator, make a scatter plot of the data in the table. b) Fit a logarithmic function to the data. Discuss the fit using the correlation coefficient. c) Use your model to predict the height of the tree when Kim is 30 years old.
The growth of a tree a) This is how the data looks when plotted in a scatter plot. b) Use the logarithmic regression (“LnReg”) feature of your graphing calculator to fit a function to the data: The regression equation is: y = 2.999 + 5.055lnx The correlation coefficient is r = 0.986 so the data is a good fit. c) By evaluating the function at x = 30, we can predict that the tree will be approximately 20.2ft.