Download

1 / 10
100 likes | 217 Views
This finance report, prepared for the Board of Directors, outlines the Trust's financial performance for the two months ending May 31, 2013. Key metrics include a cash position of £39.2m, a financial risk rating of 2.40, and a savings target of £30.1m for the fiscal year. The report highlights performance against income and expenditure plans, indicating a deficit of £0.51m when accounting for exceptional costs. Areas of focus include operational efficiencies, risks, and ongoing measures to meet financial objectives for sustainable future development.

E N D
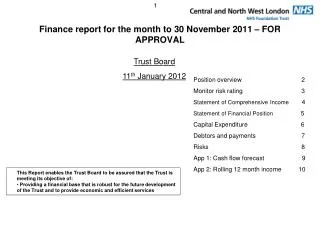
Board of Directors 17 July 2013 Finance report for the 2 months to 31 May 2013 – FOR APPROVAL Page Position overview 2 Monitor risk rating 3 Statement of Comprehensive Income 4 Statement of Financial Position 5 Capital Expenditure 6 Debtors and payments 7 Risks 8 App 1: Income & Exp. forecast 9 App 2: Cash Forecast 10 • This Report enables the Board of Directors to be assured that the Trust is meeting its objective of: • Providing a financial base that is robust for the future development of the Trust and to provide economic and efficient services
Position Overview • Cash • Overall, the Trust had cash and short term investments of £39.2m at the end of May’13. These have been impacted by the delay in receipts due for the period for the current year’s contracts. • Monitor rating • The Trust’s financial risk rating for the month is scored at 2.40. • CIP and contract reductions delivery • The Trust has a savings target of £30.1m for 13/14 which includes savings required due to reduction in contract values and QIPP, as well as internally generated efficiency requirements, and any unachieved or non recurrent CIP from 12/13; • CIPs to the value of £17.05m (66%) have been identified, after being risk assessed the value likely to be delivered is £11.03m, this leaves a gap of £19.07m (63%) that still needs to be identified or the risk of non-delivery needs to be reduced; • Meetings continue to take place with Service and Corporate Directors to identify more measures to close the gap; • For comparison purposes the (non risk-rated) gap at month 2012/13 was £9.6m (47%). EBITDA The Trust’s EBITDA margin for the month ending 31st May 2013 was £1.33m (1.88%). This is behind the Monitor plan (£3.10m/4.47%) Surplus The Trust has delivered a deficit, excluding restructuring costs of (£0.29m). When exceptional costs, relating to the restructure (£0.21m) are included this gives a total deficit of £0.51m, which is the figure reported in Appendix 1. The surplus excluding exceptional items at the same time last year was £0.39m.
The Trust’s overall risk rating is scored at a 2.40 for the year to date, against a plan of 3.70. With the cumulative surplus behind plan, this has had a cumulative impact on the current risk rating. • It should be noted that profit on the sale of assets, restructuring costs, and asset impairments are excluded from the risk ratings as they are not indicative of underlying financial performance. Monitor Risk rating Additional risk indicators • Monitor requires Foundation Trusts to report on ten risk indicators that give an indication of the level of financial risks facing individual Trusts. These indicators do not have a bearing on the formal risk rating. They are reported on an exception basis although there are no exceptions to report for the second month running.
Comparisons to budget Comparisons have been made against plan as it is against the plan, rather than operational budgets, that the Trust is assessed by Monitor. Income Income (£70.37m) is ahead of plan (£69.29m). Since submitting the plan categorisation of income has been reviewed and some income has been transferred from Other Income to Operating Income, therefore these variances will be looked at together. Some of the combined variance is due to a favourable outcome of estimated activity levels at 2012/13 year end. Of note are HIV services, actual performance was £216k higher than accrued and over performance on mental health contracts of £78k higher than the estimate at year end. In the services Offender Care had unbudgeted income (£0.16m) for additional work at Wormwood Scrubs, this is offset in non pay expenditure. There was over performance in the rehabilitation service line of £0.25m. Sexual health had over performance against their income target of £0.35M. Services in Milton Keynes have generated income of £0.20k higher than plan. Education, training and research are behind plan due to differences between phasing in the plan and in budgets. Statement of comprehensive income – Month to 31st May ‘13 • Expenditure • Pay expenditure is £1.34m higher than plan. Pay CIPs included in the plan (£0.56m) are in line with those actioned at month 2 (£0.61m) therefore the overspends are not due to CIP. Some of the over spends will be off set by income for cost per case activity requiring 1:1 nursing. The majority of this relates to corporate budgets due to unfunded posts and project work , as well as overspends in HCH and Offender Care. • Agency spend in month 2 was £1.6m and £1.2m excluding Milton Keynes, which compares with £1.2m at month 12 and £1.2m for the same period last year. However the Trust has reconfigured a number of services in 2012/13 and these figures are no longer directly comparable. • Bank costs were £1.3m per month at year end 11/12. At month 5 in 12/13 there was a small decrease in spend to £1.14m, at month 6 this rose to £1.3m. From months 7 to 9 bank spend was below £1m, and rose to £1.1m at month 12. The new financial year opened with bank spend of £1.4m, which at month 2 has fallen to £1.1m. Spend on bank nursing in Milton Keynes is £0.16m. • Non pay expenditure is £1.54m behind plan. CIP included in the plan for non pay expenditure is £0.58m and CIP adjustments made to month 2 total £0.46m, therefore £0.12m of the variance is due to slippage in CIP plans. There is an overspend on Drugs of £0.4m, which is offset by income relating to HIV. Non NHS healthcare is over spent by £0.9m, with £0.1m relating to placements in the Harrow S75 agreement and the balance in Milton Keynes.
Statement of financial position as at 31 May • Summary • • Non current assets stand at £185.4m. This leaves the non-current assets at £4.2m behind plan. However, the plan had anticipated the transfer in of PCT asset transfers from Hillingdon, Camden and Enfield. The final figures are not yet finalised and therefore adjustments not yet reflected in Property, Plant & Equipment and the corresponding entries in the Revaluation Reserve and Public Dividend Capital funding the transfer. The true trend against plan will be more accurately tracked once the accounts have reflected the adjustments required. • • NHS Trade Receivables stand at £22.2m (plan £12.8); • • Accrued Income stands at £10.8m (plan 8.3m); • • Current (expenditure) accruals stand at £22.9m (plan £21.6m); • • Cash and short term investment balances are £39.2m against a plan of £56.5m. The negative variance of £17.2m has been mainly due to:- • • (£9.3)m Increase in NHS Trade Receivables; • • (£2.5)m Increase in Non NHS Trade receivables; • • (£2.5)m Increase in Accrued Income; • • (£5.5)m Decrease in Trade Payables; • • (£1.2)m Decrease in Deferred Income; • • £1.2m Increase in current accruals; • • £1.2m Decrease in deferred income; • • £0.6m Increase in other payables; • • £0.6m Decrease in other receivables. • The overall impact on the Taxpayer's equity has been a net reduction of £6.5m, some of which is attributed to retained earnings falling behind plan by £1.9m NB. Planned retained earnings is based on an assumption of equal monthly profiling of the total planned surplus for 2013-14 of £8.5m.
Capital Expenditure 6 Summary: M02 Cumulative spend to date on Estates capital projects to May 2013 stood at £2.86m (PPE £1.06m and Intangibles £1.8m) against an original approved Estates plan for the year to date of £2.46m (full year £14.75m). Of the £1.8m spent on Intangibles, £0.1m went on Intangible assets for the IT Capital programs; whilst £1.7m went on Intangible AUCs also for the IT Capital programs. Cumulative depreciation for Tangibles totals £0.71m, whilst cumulative amortization costs for Intangibles total £0.17m. The total depreciation/amortizations costs of £0.88m is a 25% increase when compared to the same period last year. Detail: Month 02 At project level, the key trends in the Trust’s YTD capital expenditure are set out below: - Hillingdon Project work has cost the trust £0.2m; - Park Royal project work cost a total £0.09m; - £1.9m was spent on IT; - Various upgrades and improvements costs to the SK&C & St Charles sites total £0.14m; - Legal Fees & Contingency costs amount to £0.12m - Air-conditioning improvement at new short lease site - Archway, has cost the trust £0.07m; - The Sanitary Facility upgrade costs at Roxbourne total £0.07m; - Camden Community Services costs total £0.13m; - The total cost of works done at the Kingswood Site is £0.05m; - Other small additions to date total £0.06m.
Debt summary • Total debt was £28.7m as at the end of May ’13. This balance remains high due to several high value 2013-14 contracts which have been invoiced for but not yet agreed and therefore have not yet materialised into cash receipts. • In May ’13 the Trust’s 90+ days debtor performance was 1% (£322k of debtors net of provided for debt) meeting the Trust’s target of 5% (£1.3m). • The trust has a bad debt provision of £962k to reflect its ageing bad debt >90 days. Aged debt The graphs opposite show the debt ageing profile and the type of debt. The key debts that were more than 90 days overdue as at 31 May were as follows: -Harrow PCT £286k – LD and Section 75 invoices to be resolved in M3 – escalated to Deputy Director of Finance; -Hillingdon Hospital£198k - A&E CPN funding disputed – Head of Contracts to resolve in 2013-14; -Brent Pct £176k – Cost per case invoices to be resolved in M3 2013-14 – escalated to Deputy Director of Finance; -LB of Hillingdon - £129k continuing care funding dispute - Head of Contracts liaising with Borough to resolve long standing dispute. Debtors & Payments Payments In May ’13 the Trust’s 90+ days creditor performance was 4.6% (£804k) against target of 5% (£882k), compared to 2.7% last month. There are some high value disputed invoices exceeding 90 days+ The key credit balances that were more than 90 days overdue and under dispute as at 31 May were: -Westminster PCT £89k - Rent & rates invoices disputed by Estates; -North West London Hospitals £41k – Disputed patients travel and staff parking invoices to be reconciled; -UCLH £16k – Further details requested for invoices. Performance against Better Payment Practice Code NHS – The Trust paid 66% (64% last month) of total transactions by number, and 89% (89% last month) of total transactions by value, within 30 days. There are ongoing issues with some NHS bodies routinely not providing sufficient information on invoices to enable the invoices to be automatically sent to the correct budgetholder for approval. Non NHS – The Trust paid 74% (75% last month) of total transactions by number, and 70% (70% last month) of total transactions by value, within 30 days.
9 Appendix 1 – Rolling 12 month statement of comprehensive income forecast