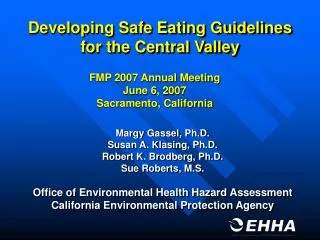
Developing Safe Eating Guidelines for the Central Valley
550 likes | 681 Views
This document outlines the developments in safe eating guidelines for fish consumption from the Central Valley's 2007 FMP Annual Meeting. Led by experts like Dr. Margy Gassel and Dr. Susan Klasing, it reviews monitoring activities, health assessments, and risk communication strategies employed by the Office of Environmental Health Hazard Assessment (OEHHA) in California. The report highlights the action taken regarding fish advisories for areas affected by high mercury concentrations, alongside public outreach efforts to educate the community on safe fish consumption practices.

Developing Safe Eating Guidelines for the Central Valley
E N D
Presentation Transcript
Developing Safe Eating Guidelines for the Central Valley FMP 2007 Annual Meeting June 6, 2007 Sacramento, California Margy Gassel, Ph.D. Susan A. Klasing, Ph.D. Robert K. Brodberg, Ph.D. Sue Roberts, M.S. Office of Environmental Health Hazard Assessment California Environmental Protection Agency
OEHHA’s FMP Activities • Task 1 & 3: Monitoring design to characterize water bodies to support developing advisories. Formulate monitoring plans for sport fish. • Task 7: Assess risks in water bodies using existing data or project data and develop fish consumption advisories. • Task 8: Communicate risks and safe eating guidelines using advisories and associated materials.
2006-2007ActivitiesMonitoring • Developed 2006 sampling matrix and sampling plan for advisory development • Sacramento River, tributaries, North Delta • Lake Shasta and other northern reservoirs • Striped bass, shad, sturgeon • Interactive coordination with DFG during sampling • DFG reported collections on a regular basis • OEHHA feedback • OEHHA created analysis instructions
2006-2007ActivitiesMonitoring - continued • Considered revising spreadsheet format • Consistent and user-friendly files • DHS reported results for collection of fishing site, activity and species data for 2007 in consistent format (one “site” per row) • DFG revised format for collection results to include sample weights and show distinct samples (one fish per row)
2006-2007ActivitiesHealth Assessment • Developed Draft Safe Eating Guidelines • Lower Feather River – released in August 2006 • San Joaquin River and South Delta – released in March 2007 • Developing a risk/benefit paradigm for fish advisories • Data review for 2007 • Sacramento River and North Delta
2006 ActivitiesCommunication • Coordinated with DHS for public workshops and training for new advisories • Lower Feather River public workshopat tribal health center • DHS translated fact sheet into Spanish • San Joaquin River and South Delta public workshop at LSAG meeting • DHS translated advice into Hmong andSpanish
2006 ActivitiesCommunication - continued • Continued coordination with DHS on Delta outreach plans & materials • updated Delta sign • Incorporated more emphasis on health benefits and safe fish for San Joaquin River and South Delta advisories
Susan Klasing, Ph.D. Margy Gassel, Ph.D. Sue Roberts, M.S. Robert Brodberg, Ph.D. Acknowledgements: Michelle Wood: CVRWCB Jay Davis, Ben Greenfield: SFEI Jason May, Charles Alpers,James Rytuba, Darell Slotton: USGS Peter Otis: RWQCB Thomas Suchanek: USFWS
Background • Review of historical data revealed high mercury concentrations in fish from the Cosumnes River and the Feather River • OEHHA prioritized these two areas for next advisories • Additional sampling planned in FMP • Draft Safe Eating Guidelines for the Lower Cosumnes and Lower Mokelumne Rivers – issued April 2006 • Draft Safe Eating Guidelines for the Lower Feather River – issued August 2006
SAFE EATING GUIDELINESFOR FISH CONSUMPTION FROMTHE LOWER FEATHER RIVER Women of childbearing age, pregnant or breastfeeding women, and children 17 years and under:
SAFE EATING GUIDELINESFOR FISH CONSUMPTION FROMTHE LOWER FEATHER RIVER Women beyond childbearing age and men: *Sunfish may be eaten up to 3 times a week by this population
Review of Omega-3 Fatty Acids and the Health Benefits ofFish Consumption • Comprehensive review of literature • state of knowledge on physiological action ofomega-3 fatty acids • Reviewed Institute of Medicine (IOM) Report • Presentation to LSAG January 24, 2006 • Developing risk/benefit paradigm for fish advisories Susan Klasing
Why Important • American Heart Association (AHA) recommends 6 ounces cooked fish a week (24 g/day) • Average U.S. fish consumption is14 g/day (NHANES 1999-2002) • The average U.S. population intake of EPA& DHA is 103 mg/day (¼ the recommended intake) • Reconcile differences between entities providing fish consumption guidelines
Other Recommendations toEncourage Seafood Consumption Dietary Guidelines Advisory Committee Report: Two servings (approximately eight ounces) per week of fish high in omega-3 fatty acids My Pyramid: Eat fish rich in omega-3 fatty acids, such as salmon, trout, and herring, more often American Diabetes Association: Eat 2-3 servings of fish per week to lower the risk of diabetes and protect your heart and blood vessels World Health Organization: Eat fish 1-2 servings per week (equivalent to 200-500 mg of EPA+DHA/serving) to protect against heart disease and stroke United Kingdom Scientific Advisory Committee on Nutrition: Eat two servings of fish per week, one of which should be oily, to provide approximately 450 mg/day of EPA+DHA
IOM Report Conclusions Purpose was to analyze overall effect of seafood consumption – not just to reduce a specific risk or enhancea specific benefit • Lack of information on the benefits of seafood consumption • Lack of reach of state advisories
IOMImpact of State Advisories • Awareness of advisories is low • Awareness higher among males than females • Risk information as presented in advisories appears to increase reluctance to consume seafood
IOMImpact of State Advisories • Evidence that “risk-risk” information may influence risk perceptions more than “benefit-risk” information • Warnings can change perceptions and beliefs but unintended effects, such as overreactions, may occur
IOMBalancing Choices:Supporting Consumer Seafood Consumption Decisions • Advice to consumers from the federal government and private organizations on seafood choices to promote human health is fragmented • Risks are addressed separately from benefits • Portion sizes differ • Multiple pieces of guidance – sometimes conflicting – simultaneously exist
New Risk/Benefit Paradigm • Addresses consumers’ desire to delineate “good fish/bad fish” • Attempts to increase benefits while maintaining acceptable risk • Aims for consistency in advice with the nutrition and medical communities • Aims to support public health
Margy Gassel, Ph.D. Robert K. Brodberg, Ph.D. Susan Klasing, Ph.D. Sue Roberts, M.S. Acknowledgements: Michelle Wood: CVRWCB Darell Slotton, Shaun Ayers: UCD Aroon Melwani, Shira Bezalel, Letitia Grenier: SFEI Alyce Ujihara, Elana Silver, Jessica Kaslow: DHS
Available Data • FMP – Year 1 • 25 sampling locations; 10 species; 775 samples • Historical data – large mercury dataset compiled by CVRWQCB • TSMP/SWAMP; CALFED Mercury Project;UC Davis • Chlorinated hydrocarbons (limited) • PCBs:TSMP (1998 or 2000); SFEI(Sac-SJ Delta and Lower SJ River study, 1998) • Dioxins/furans: DHS (ATSDR)
Study Area San Joaquin River and South Delta
Data Evaluation • Site-specific • Site groupings • Delta subareas
Comparisons of Average Mercury Concentrations Between Subareas
Comparison of Subregions Hypothetical 350-mm Largemouth Bass:
Comparison of SubregionsMultiple Regression CorrelationLargemouth Bass • Length explained 59% of variance(p < 0.001) • After controlling for length, subregion explained 12% unique variance(p < 0.001) • N.S. Interaction factor
Comparison of SubregionsMultiple Regression CorrelationCatfish • White catfish • Length explained 26% of variance (p < 0.001) • After controlling for length, subregion explained 26% unique variance (p < 0.001) • N.S. Interaction factor • Channel catfish • Length explained 16% of variance (p < 0.001) • After controlling for length, subregion explained 21% unique variance (p < 0.001) • N.S. Interaction factor
“Green” Guidelines • Apply when at least 8 ounces can be eaten each week, as recommended for healthy adults by the American Heart Association • Previous advisories considered “one meal a week” (8 ounces) as “yellow” – “Eat in Moderation” • Consistent with AHA recommendation to eat “two 3-oz. servings a week”
Green Guidelines • San Joaquin River • All sampled species, except largemouth bass and striped bass • South Delta • All species sampled had low mercury concentrations • Excludes striped bass and sturgeon • Special studies underway • Follow the guidelines for theSan Francisco Bay-Delta advisory • DHS updated Delta sign accordingly
SIMPLIFY ADVICE BEST CHOICES 4 – 6 servings a week GOOD CHOICES 2 servings a week 0 – 4 servings a month AVOID Serving size is 3 oz. cooked fish
Previous Categories ENJOY 2–3 meals a week EAT IN MODERATION 1 meal a week 0 – 2 meals a month AVOID Meal size is 6 oz. cooked fish (8 oz. before cooking)
SAFE EATING GUIDELINES South Delta
SAFE EATING GUIDELINES San Joaquin River
Warnings for thePort of Stockton Area Old Mormon SloughNew Mormon Slough McLeod LakeThe Turning BasinMorelli Boat Ramp Lewis Park Boat Ramp
Health Benefits from Fish Consumption • Fish provide a good source of protein and other essential nutrients • Risk from other animal sources of protein (beef, pork) • Risk from NOT eating fish • Omega-3 fatty acids • Women and young children: cognition, neurological development, vision • For the prevention of heart disease
IMPORTANT POINTS TO REMEMBER • Eating fish has manyhealth benefits; recommendedas part of a healthy diet! • Make informed choicesabout which fish aresafest to eat and providethe most benefit • Consider all sources of fish • Stores and restaurants • Fish caught in other water bodies • Serving size changed to matchdietary guidelines
Disseminating the Advisories: Education and Outreach • OEHHA and DHS met with county Environmental and Public Health Directors & Officers before release • Held workshop on draft advisories in conjunction with LSAG meeting 3/20/07 • Open to county and agency staff, CBOs, and the general public • Evaluation forms
Stakeholder Feedback • Draft advisories • Advisory format in flux • Evaluation forms • Comprehension • Importance of benefits information • Need more!
Stakeholder Responses and Comments • Half of responses noted one or more factors in advisories (e.g., location, population, type of fish) • Suggestions (e.g., clarify healthy fish choices from all sources) • Opposing views reflected (e.g., overly conservative versus not protective enough) • Serving size does not match consumption