Download
1 / 7
70 likes | 189 Views
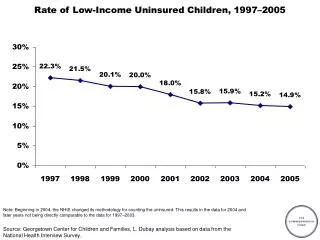
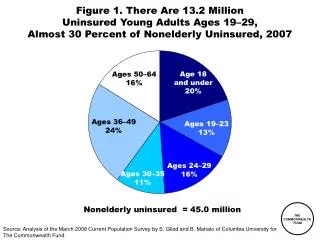
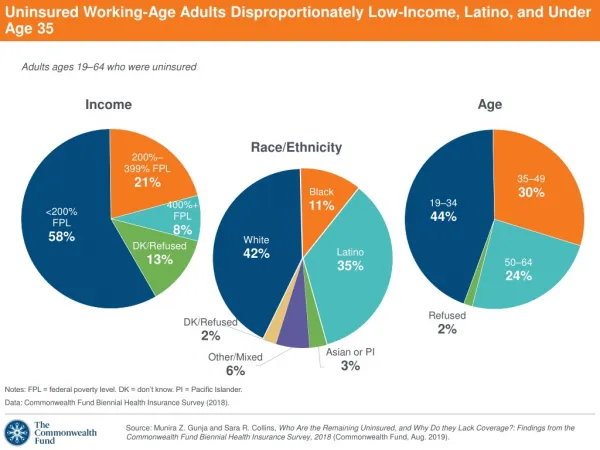
The 2018 Commonwealth Fund Biennial Health Insurance Survey reveals a significant disparity among uninsured adults aged 19–64, particularly within low-income and Latino populations. Nearly half of these uninsured individuals may qualify for Marketplace subsidies or Medicaid. Affordability concerns hinder many from accessing coverage, with one-third citing high costs as the main reason for not seeking insurance. The survey highlights the complexities involved in eligibility and enrollment, emphasizing the need for better resources and support for disadvantaged groups.

E N D
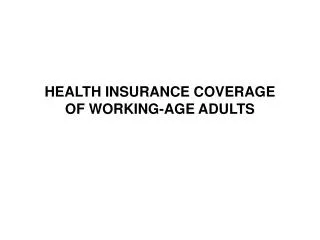
Uninsured Working-Age Adults Disproportionately Low-Income, Latino, and Under Age 35 Adults ages 19–64 who were uninsured Notes: FPL = federal poverty level. DK = don’t know. PI = Pacific Islander. Data: Commonwealth Fund Biennial Health Insurance Survey (2018).
Nearly Half of Uninsured Adults May Be Eligible for Marketplace Subsidies or Medicaid Adults ages 19–64 who were uninsured Eligible for unsubsidized coverage through the individual market or may be eligible for traditional Medicaid Eligible for expanded Medicaid or subsidized coverage through the marketplace Above subsidy eligible range Foreign-born Latinos Foreign-born Latinos <100% FPL, nonexpansion 133%–399% FPL 400%+ FPL Undesignated <100% FPL, expansion 100%–132% FPL, expansion 100%–132% FPL, nonexpansion Notes: FPL = federal poverty level. The Affordable Care Act set the top income eligibility threshold at 133% of poverty but also called for a new standardized method for calculating income. States previously had different rules about what sources of income counted for purposes of eligibility. The standardized modified adjusted gross income system automatically disregards 5% of someone's income, effectively making the threshold 138% of poverty. We use the 133% threshold in this survey. Data: Commonwealth Fund Biennial Health Insurance Survey (2018).
One-Third of Uninsured Adults Who Did Not Visit Marketplace to Get Coverage Cited Affordability Concerns Did you try to get health insurance through the marketplace? Percent of adults ages 19–64 who were uninsured What was the main reason you did not try to get health insurance through the marketplace? Percent of adults ages 19–64 who were uninsured and did not visit the marketplace * 3% of uninsured adults ages 19 to 64 who did not visit the marketplace reported it was because they had, or will have, insurance through another source, 2% reported it was because the marketplaces were not open for enrollment when they needed coverage, and 1% reported they went someplace else to look for health insurance. Respondents who reported “some other reason” cited lack of time and citizenship status, among other reasons. Data: Commonwealth Fund Biennial Health Insurance Survey (2018).
One-Third of Adults Who Lost Coverage and Were Previously Covered Through the Individual Market Cited Affordability Concerns What was the main reason you lost or dropped your coverage? Percent of adults ages 19–64 who were uninsured at the time of the survey or uninsured in the past 12 months and were previously covered by a plan bought through the marketplace or from an insurance company * 4% percent of adults ages 19 to 64 who were uninsured at the time of the survey or uninsured in the past 12 months and were previously covered by a plan bought on their own or through the marketplace reported they lost or dropped their marketplace coverage because they couldn’t get the health care they needed, 2% reported it was because they didn’t think they needed it, and 1% reported it was because they moved. Respondents who reported “some other reason” cited lack of knowledge about their coverage options, among other reasons. Data: Commonwealth Fund Biennial Health Insurance Survey (2018).
Majority of Adults Who Had Lost Coverage and Were Previously Covered by Medicaid Said They Were No Longer Eligible What was the main reason you lost or dropped your Medicaid coverage? Percent of adults ages 19–64 who were uninsured at the time of the survey or uninsured in the past 12 months and were previously covered by Medicaid * 4% percent of adults ages 19 to 64 who were uninsured at the time of the survey or uninsured in the past 12 months and were previously covered by Medicaid reported losing or dropping their Medicaid coverage because they couldn’t afford to pay for it and 3% reported it was because they couldn’t get the health care they needed. Respondents who reported “some other reason” cited a lack of knowledge about their coverage options and the complexity of the enrollment process, among other reasons. Data: Commonwealth Fund Biennial Health Insurance Survey (2018).
More Adults Had Difficulty Finding Affordable Coverage in the Individual Market in 2018 vs. 2016 Note: FPL = federal poverty level. * Bought in the past three years. ** Respondent rated their health status as fair or poor, or has any of the following chronic conditions: hypertension or high blood pressure; heart disease, including heart attack; diabetes; asthma, emphysema, or lung disease; high cholesterol. ^ Among those who ever tried buying health insurance on their own in the past three years. Data: Commonwealth Fund Biennial Health Insurance Surveys (2010, 2016, 2018).
Majority of Adults Give Their Health Insurance High Ratings Now thinking about your current health insurance coverage, how would you rate it? Percent of adults ages 19–64 who were insured and viewed their health insurance as “good,” “very good,” or “excellent” * Individual coverage includes those who purchased insurance on and off the marketplaces. Data: Commonwealth Fund Biennial Health Insurance Survey (2010, 2012, 2014, 2016, 2018).