Download
1 / 13
130 likes | 278 Views
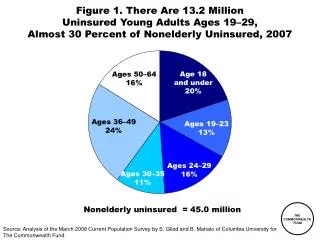
Figure 1. There Are 13.2 Million Uninsured Young Adults Ages 19 – 29, Almost 30 Percent of Nonelderly Uninsured, 2007. Age 18 and under 20%. Ages 50–64 16%. Ages 36–49 24%. Ages 19–23 13%. Ages 24–29 16%. Ages 30–35 11%. Nonelderly uninsured = 45.0 million.

E N D
Figure 1. There Are 13.2 Million Uninsured Young Adults Ages 19–29, Almost 30 Percent of Nonelderly Uninsured, 2007 Age 18and under 20% Ages 50–64 16% Ages 36–49 24% Ages 19–23 13% Ages 24–29 16% Ages 30–35 11% Nonelderly uninsured = 45.0 million Source: Analysis of the March 2008 Current Population Surveyby S. Glied and B. Mahato of Columbia University for The Commonwealth Fund.
Figure 2. Percent Uninsured, Children and Young Adults,by Poverty Level, 2007 Source: Analysis of the March 2008 Current Population Survey by S. Glied and B. Mahato of Columbia University for The Commonwealth Fund.
Figure 3. Insurance Sources for Young Adults,Ages 19–23, 2006 Own-employer 8% Own- employer 25% Uninsured 17% Uninsured 39% Individualor collegeplans 20% Employer- dependent 16% Employer- dependent 49% Other* 13% Other* 6% Individual orcollege plans 7% Not full-time students** = 12.5 million Full-time students = 7.6 million * Other includes Medicare, Medicaid, and Military. ** Includes part-time students and non-students. Source: J. L. Kriss, S. R. Collins, B. Mahato, E. Gould, and C. Schoen, Rite of Passage? Why Young Adults Become Uninsured and How New Policies Can Help, 2008 Update, The Commonwealth Fund, May 2008; Data analysis of the March 2007 Current Population Survey by S. Glied and B. Mahato of Columbia University for The Commonwealth Fund.
Figure 4. Percent of High School Graduates with Gaps inInsurance Coverage in the Year Following Graduation,by Student Status, 2001–2003* Percent of high school graduates * People who graduated from high school during 2001–2003. Source: J. L. Kriss, S. R. Collins, B. Mahato, E. Gould, and C. Schoen, Rite of Passage? Why Young Adults Become Uninsured and How New Policies Can Help, 2008 Update, The Commonwealth Fund, May 2008; Data analysis of the 2001 Panel of the Survey of Income and Program Participation by E. Gould for The Commonwealth Fund.
Figure 5. One-Third of College Graduates Had Time Uninsured in Year Following Graduation, 2001–2003* Percent of college graduates * People who graduated from college during 2001–2003. Note: College graduates are defined as those with at least a bachelor degree. Source: J. L. Kriss, S. R. Collins, B. Mahato, E. Gould, and C. Schoen, Rite of Passage? Why Young Adults Become Uninsured and How New Policies Can Help, 2008 Update, The Commonwealth Fund, May 2008; Data analysis of the 2001 Panel of the Survey of Income and Program Participation by E. Gould for The Commonwealth Fund.
Figure 6. Availability of and Workers’ Eligibility for Employer Insurance, Among Workers Ages 19–64 Note: Workers include full-time and part-time workers. Source: J. L. Kriss, S. R. Collins, B. Mahato, E. Gould, and C. Schoen, Rite of Passage? Why Young Adults Become Uninsured and How New Policies Can Help, 2008 Update, The Commonwealth Fund, May 2008.
Figure 7. Distribution of Uninsured Young Adults Ages 19–29 by Poverty Status and Race/Ethnicity, 2006 Other 7% 200% FPL or more 29% Less than 100% FPL 41% White 45% Hispanic 33% 100%– 199% FPL 31% African American 15% Uninsured young adults = 13.7 million Source: J. L. Kriss, S. R. Collins, B. Mahato, E. Gould, and C. Schoen, Rite of Passage? Why Young Adults Become Uninsured and How New Policies Can Help, 2008 Update, The Commonwealth Fund, May 2008; Data analysis of the March 2007 Current Population Surveyby S. Glied and B. Mahato of Columbia University for The Commonwealth Fund.
Figure 8. Months Uninsured Among Young Adults, 2001-2003 *People who were 19–23 at beginning of survey in 2001. Source: J. L. Kriss, S. R. Collins, B. Mahato, E. Gould, and C. Schoen, Rite of Passage? Why Young Adults Become Uninsured and How New Policies Can Help, 2008 Update, The Commonwealth Fund, May 2008; Data analysis of the 2001 Panel of the Survey of Income and Program Participation by E. Gould for The Commonwealth Fund.
Figure 9. Annual Per Capita Total Health Expenditures by Age Group, 2008* Dollars * Inflated to 2008 dollars using actual and estimated annual growth rates in national health expenditures. Source: J. L. Kriss, S. R. Collins, B. Mahato, E. Gould, and C. Schoen, Rite of Passage? Why Young Adults Become Uninsured and How New Policies Can Help, 2008 Update, The Commonwealth Fund, May 2008; Data analysis of the 2005 Medical Expenditure Panel Survey by S. Glied and B. Mahato of Columbia University for The Commonwealth Fund.
Figure 10. Lacking Health Insurance for Any Period Threatens Young Adults’ Access to Care, 2007 Percent of adults ages 19–29 reporting the following problems in the past year because of cost: Source: J. L. Kriss, S. R. Collins, B. Mahato, E. Gould, and C. Schoen, Rite of Passage? Why Young Adults Become Uninsured and How New Policies Can Help, 2008 Update, The Commonwealth Fund, May 2008.
Figure 11. Young Adults Without Insurance Are Less Likely to Have a Regular Doctor, 2007 Percent of adults ages 19–29 who have a regular doctor Source: J. L. Kriss, S. R. Collins, B. Mahato, E. Gould, and C. Schoen, Rite of Passage? Why Young Adults Become Uninsured and How New Policies Can Help, 2008 Update, The Commonwealth Fund, May 2008.
Figure 12. Young Adults with Any Time UninsuredHave High Rates of Medical Bill Problems, 2007 Percent of adults ages 19–29 who had the following problems in past year: * Includes only those whose bill was sent to a collection agency when they were unable to pay the bill. Source: J. L. Kriss, S. R. Collins, B. Mahato, E. Gould, and C. Schoen, Rite of Passage? Why Young Adults Become Uninsured and How New Policies Can Help, 2008 Update, The Commonwealth Fund, May 2008.
Figure 13. 25 States Have Increased the Age Up to Which Young Adults Are Considered Dependents for Insurance Purposes Note: South Dakota, Rhode Island, Idaho, and Virginia’s laws apply only to full-time students. Source: J. L. Kriss, S. R. Collins, B. Mahato, E. Gould, and C. Schoen, Rite of Passage? Why Young Adults Become Uninsured and How New Policies Can Help, 2008 Update, The Commonwealth Fund, May 2008, updated for 2009.