Download
1 / 52
530 likes | 556 Views
Weir Reticle Haze Detection and Monitor. What, Why and How to control reticle haze issues. Sections. Reticle Haze Concepts Base Method of Weir Haze Detection Weir PW Characterization Weir DM macro setup of Weir PW method Weir DMA automation of input & output data.

E N D
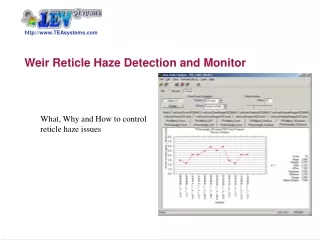
Weir Reticle Haze Detection and Monitor What, Why and How to control reticle haze issues
Sections • Reticle Haze Concepts • Base Method of Weir Haze Detection • Weir PW Characterization • Weir DM macro setup of Weir PW method • Weir DMA automation of input & output data
Reticle Haze Detection with Weir PW & Weir DMA • Haze formation on reticle continues to be a significant problem for the semiconductor industry. • Haze can be formed on the outside pellicle and on the quartz back side of the reticle. • Major component of the haze is known to be aluminum sulfate that comes from the reticle cleaning process and Deep Ultra Violet interactions with residue. • The reticle materials, the exposure wavelength, roughness of photomask and this haze will affect the resolution and process latitude.
Reticle Haze Sources • Mask making materials • Process residues • Reticle container • Fab or Scanner environment
Issues for reticle cleaning • - for DUV lithography • Phase and transmittance change • Surface contamination • - for VUV lithography • Phase and transmittance change • Surface contamination • ESD • - for EUV lithography • Reflectance change • Affect of debris?
Reticle Haze Influence Transmittance Reduction • Transmittance reduction caused variations in the CD and DOF values. • Aberrations will increase: • Since the reticle is an element of the scanner optical train • Process Window size will decrease and shift center
Reticle Haze Influence Transmittance Reduction • CD Increase with transmittance loss for a 90nm A.P.S.M.
Reticle Haze Influences Dose Change • Expose energy change with transmittance loss for different reticle. • Backside glass haze can effect overall mask transmission and thus can cause a dose shift on the wafer . A dose shift can be serious because most of low k1 process run with a very small process window and cause serious yield issue.
Reticle Haze Influences Throughput • Throughput will • decrease due to an increase dose required to make same line width. • change with transmittance loss for different reticles.
Wafer flatness Device topography Effective Dose Sources of CD variation across the wafer Reticle Scanner Track & Process Substrate BARC coat Transmission Exposure Dose Flatness Resist Film coat Slit Uniformity CD’s PEB Temp & Time Focus SetUp Develop Chuck Flatness Up-Down Scan Effective Focus Scan Linearity CDU • Primary disturbances causing CD Uniformity (CDU) variations grouped upon their sources. • Reticle transmission loss directly influences the effective dose • Indirectly increases aberrations in the optical train that result in ACLV CD Variation increase
Monitoring the process for Reticle Haze Haze is formed around the pellicle,on the quartz side of the mask and on thechrome side of the mask.
Haze Appearance Clean reticle Cleaning Residue Cleaning residue & process Process Induced Reticle Haze • Haze influence on the image can be symmetric or anti-symmetric: • Radial • Process induced • Exposure enhanced • Across-Reticle • Reticle Cleaning • Scattered and random • Equipment sourced • Testing for Haze • Requires multiple points on field • Examine • relative CD uniformity • DoF • Optimum and IsoFocal Dose • Dose Uniformity
Method of Reticle Haze Monitor • Automate data gathering with Weir DMA interface to factory control • Automatically output critical process variables to factory-control system • Setup Weir DM Macro to duplicate Weir PW analysis • one-step processing for the wafer fab. • Setup online trend charts for variables • Weir PW Characterize Dose Uniformity • Determine Normal Process Window levels for multiple points on the field
Weir PW Dose Uniformity Setup for Initial Characterization Setup Focus-Dose or Dose Matrix Derive base-response of process
B Feature Size A UCL EL LCL DoF One curve for each dose Focus Bossung curve analysis anatomy Focus Response Analysis • A = Isofocal Dose • Dose at which feature size is independent of Focus • B = Locus of Best Focus • “Best Focus” is located at the maxima or minima of each dose curve • The greater the curvature, the greater will be the aberrations of the system • UCL/LCL • Upper and Lower Control Limits for the process • EL • Exposure Latitude or the dose range over which the feature size lies between the UCL and LCL • DoF • Depth of Focus or the focus range over which the feature size lies between the UCL and LCL Curve “B” is highly sensitive to lens aberrations Reticle haze directly influences the aberrations of the tool.
Weir Dose Report These variables will be gathered by Weir DM & Weir DMA
Dose curves calculated at best focus Upper Blue Curve Linear Dose curve that reflects the resist’s true response. Exposure Latitude (EL) can now be evaluated. Point-spread at each dose is the result of reticle feature size variance. Lower Red Curve Plotted Best Focus for each site. A discontinuity occurs with this data when the IsoFocal point is crossed. EL Dose Response Analysis
Isofocal Analysis Isofocal deviant curves Aberration level at each dose Dose Response Analysis • Isofocal Analysis: All-sites on field, BCD features Vertical (black) and Horizontal (red) • Calculate IsoFocal dose for each feature and site • Classic: IsoFocal point is found when the 2nd derivative of the process window = 0 • Bossung: IsoFocal deviant = the magnitude of the 3rd Bossung curve coefficient • Isofocal point is at the minimum for the curve • 2) Lower curves: Level of aberrations for the dose plotted as magnitude of 2nd Bossung curve coefficient
Optimum Field Response thru Dose • BCD summarizes natural feature size response @ best Focus for each dose • DoF computed when in control
Weir DM Daily Monitor Interface Macro-Encapsulation of Weir PW Analysis One-Step data selection and analysis. User customized: Graphics Statistics setup Variable Trend Tracking Variable ouput
Weir DM Macro Types • Weir PSFM focus reticle analyses • Focus/Expo Matrix • Functionality • Best image analysis of lens aerial image • Requirements • Benchmark PSFM reticle • Initial dataset of a PSFM Focus matrix • Fixed-Focus Analysis • Functionality • Analysis of wafer flatness, photoresist flatness, process focus and exposure tool autofocus/ auto-leveling stability. • Requirements • Benchmark PSFM reticle • Initial dataset of PSFM fixed-focus, full-wafer • Same layout and exposure as monitor wafers will be • Same exposure as PSFM calibration tempalte • Weir PW analyses • Raw Metrology • Reticle Haze and Process Window Monitor • Raw metrology and tool Monitor are same • Statistics and modeling on any metrology data set • Requirements • Initial data set with same exposure and layout as future daily monitors
Weir Macro setup for Process Window Analysis Weir PW Example data – Forms basis for template Template
Select from 4 types of analysis Focus Dose PW Dose @ BF • Reticle Haze is best analyzed with the “Dose @ Best Focus” analysis
Weir DM Target Values Setup • Variables are determined by user-data • Automated culling and modeling supported
Optimum Dose Trend for mixed OPC - BCD Dataset or date can be trended on abscissa
Reports & Graphics for current dataset Reports that appear during the analysis of each data set. Upper chart summarizes the focus and dose for each site. Lower graph displays the final dose-plot for all five sites of one data set.
Call-Log for Weir DM Can be used to track and perform analysis diagnostics.
Raw as well as modeled data trends Raw “Range” data for the 12 data sets analyzed. One interactive point, text is “yellow-note”, has been highlighted by the user’s mouse.
Summary Data Selection For Full-Field for Process-Window detection of Reticle Haze
Reticle Haze can also influence Best Focus Uniformity Here Best Focus is calculated from the process-window Focus-Dose Matrix
Weir DMA - Daily Monitor Automation Automation of Weir DM for calling by shop-flow and other control systems. Includes input data specification, analysis logs, internal trends and data report outputs in text and html format.
Run-log format • Default folder = %Weir DM home% • Default = Weir DM home folder • To change use “Tools/Options” menu and the DMA tab • File Name • RemoteCall.Log • Format = ASCII • Contents • Contains analysis summary plus any errors • Sample: • ____ • Weir DMA: ver: 3.8.55 ‘ start of new analysis • System ID: 1C2CE5A7 • Analysis Start: Wednesday, July 28, 2004 2:36:50 PM ‘ next line is the input command line • Cmd: -t "C:\Program Files\Weir Wavefront Engineering\Templates\DS1_FF_DMtemplate.XLT" -d 040525153141.txt -o D:\TEMP -x D:\TEMP • runDM Start: 2:36:50 PM • cmdLineParse Start: 2:36:50 PM ‘ command line interpreted correctly • DM Start: 2:36:50 PM • runDMoutput Start: 2:36:59 PM ‘ actual analysis start • Output: D:\Temp\040525153141_WeirDMA.csv ‘ output to ASCII file • Output 56 statistics. • OutputXLS: D:\Temp\040525153141_WeirDMA.xls ‘ optional output to excel workbook • Output 56 statistics. • run DM successful ‘ signifies completion without errors • Analysis End: Wednesday, July 28, 2004 2:37:00 PM …____
Reticle Haze & Full-Field Process Window Monitor Optional: Model wafer and field focus Import data & save Call DMA with Macro & Data Display current-data graphic Weir DMA output to ASCII (*.csv) and Excel (*.xls) files Update Trend charts Weir DMA outputs status and any errors to RemoteCall.log
Moving a Weir DM macro • When moving a Weir DM macro to another computer: • Copy the macro (*.XLT) into the new computer’s template directory • Make sure the directories in the macro correspond to those in the new computer: • Data directory • Macro storage directory • Reticle storage directory • Insure the “Tools/Options” interface in the new computer specifies the proper data import filter. • Import Filter can also be called by Weir DMA
Check Weir DMA Options • Options interface is located on the Weir DM “Tools/Options” menu. • Here we’ve changed the location of the DMA analysis log file “RemoteCall.log” to the “D:\Temp” folder. • The Max/Min options will be used to limit the size of this log file.
Running Weir DMA – RemoteCall.log • -t "C:\Program Files\Weir Wavefront Engineering\Templates\DS1_FF_DMtemplate.XLT" • -d 040615210805.txt -o D:\TEMP -x D:\TEMP • This is the RemoteCall.log format • Switches used for the analysis are shown above-left • Screen shows the status output of two successful data runs
RemoteCall.log Weir DMA: ver: 3.8.56 System ID: 1C2CE5A7 Analysis Start: Friday, July 30, 2004 4:00:34 PM Cmd: -t "C:\Program Files\Weir Wavefront Engineering\Templates\DS1_FF_DMtemplate.XLT" -d 040615210805.txt -o D:\TEMP -x D:\TEMP runDM Start: 4:00:34 PM cmdLineParse Start: 4:00:34 PM DM Start: 4:00:34 PM runDMoutput Start: 4:00:43 PM Output: D:\Temp\040615210805_WeirDMA.csv Output 55 statistics. OutputXLS: D:\Temp\040615210805_WeirDMA.xls Output 55 statistics. run DM successful Analysis End: Friday, July 30, 2004 4:00:45 PM • This file will also show any errors encountered and should be monitored regularly.
Files in output directory • Consist of two sets of ASCII and XLS output data files along with the call log.
Output Data File ,FocusMin::,0, ,[EndHeader],, ,,, ,[Results],, ,,, ,[Z (Mean)],, ,Wafers:,1, ,Sites/Die:,2, ,#Dice:,5, ,IFD:,0.199, ,BF(Fitted):,0.000, ,X Tilt(urad):,0.000, ,Y Tilt(urad):,0.000, ,Astigmatism:,0.135, ,Curv(nm/cm2):,0.000, ,IFDresid(um):,0.000, ,StDEVresid(um):,0.000, ,Count:,10, ,Mean:,0.017, ,Median:,0.036, ,SEM:,0.018, ,Maximum:,0.136, ,Minimum:,-0.063, ,Range:,0.199, ,MinMax:,0.136, ,StDev:,0.058, ,Mean+3Sigma:,0.190, ,[EndResults],, ,[END],, ,[Data],, ,Program:,Weir DMA, ,,, ,DataFile:,040525153141.txt, ,DataFolder:,D:\Data\UMC\WeirDM Testing, ,Template:,DS1_FF_DMtemplate.XLT, ,TemplateFolder:,C:\Program Files\Weir Wavefront Engineering\Templates, ,AnalysisDate:,7/28/2004, ,AnalysisTime:,12:00:00 AM, ,Tool:,, ,Wafers:,1, ,,, ,[Header],, ,DateTemplateSaved:,7/27/2004, ,Analysis:,Fixed Focus, ,FocusTemplate:,UMC DS5-Step2, ,ConversionMethod:,All Sites, ,ModelData:,True, ,Statistics:,1, ,Graphic:,1, ,GraphicData:,0, ,WaferFieldGraphic:,Wafer, ,GraphicPlot:,Vector, ,GraphicDataFormat:,All Points, ,Comments:,, ,Summary:,Analysis:Fixed Focus:All Sites (UMC DS5-Step2) • Partial display of output file • Specifications are in the manual. • Each section of the data is summarized by a header line in “[]” brackets
Trend summary • The modeled summary of the 8 data files can be found if we go back into Weir DM