Download
1 / 26
270 likes | 424 Views
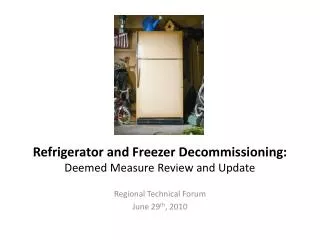
Residential Refrigerator & Freezer Decommissioning Measure Update. May 13 th , 2014. Measure Name: Residential Refrigerator & Freezer Decommissioning. Measure Type: UES Measure Category: Proven Measure Sector: Residential Sunset Date: June, 2014

E N D
Residential Refrigerator & Freezer Decommissioning Measure Update May13th, 2014
Measure Name: Residential Refrigerator & Freezer Decommissioning. Measure Type: UES Measure Category: Proven Measure Sector: Residential Sunset Date: June, 2014 Reason for Update: Update to R2/ Brother-In- Law Factor, Additional Evaluation Data, ProCost Template Measure background
Inclusion of Non Energy Benefits. Guidance on R2 / Brother-In-Law Factor. Staff Highlighted Areas
Transferred analysis into latest ProCosttemplate. • Updated previous program data (PY '10-'11) with latest data from JACO and ETO (PY '12-'13). • Inculcated latest evaluation data from the PNW (ETO, PacifiCorp WA & ID) • NEB calculated and applied to TRC Measure Update Summary
Refrigerator Decommissioning Methodology: A primer. If the refrigerator was not recycled… …but it was recycled, so energy savings depend on the counterfactual. 495 Sold/ Donated 1137 -515 Induced Replacement Left on grid: % of total units recycled Total no. of units recycled 1137 No Replacement Kept and used Induced Replacement 622 Recycled unit would have been off-grid without the program 0 Left off grid: 1 - % of total units recycled Induced Replacement -515
A Southern California Edison (SCE) evaluation conducted by Cadmus (2013) estimated that net-NEB in CA range from $19 to $79 per recycled unit. • NEB occur due to added societal benefit from disposing refrigerators via EPA recommended methodology as opposed to baseline disposal practice. • Baseline determined via customer survey of program participants. • ETO administered similar survey, this data was applied to calculate numbers pertinent to the NW. Non Energy Benefits (NEB)
Surveyed customer baseline disposal practices in the absence of the program divided into four bins. • Bin 4 is closest to EPA compliance; bin1 is farthest from EPA compliant disposal practice. • ETO data used to develop NW specific values Non Energy Benefits (NEB) – Northwest Specific Values
Compile list of waste materials from refrigerator, freezer disposal. • Calculate weight/ count of each raw material per appliance. • Each discard scenario represents a different combination of material-specific disposal methods. • Estimate the monetary benefit from EPA compliant disposal (as opposed to no compliance) for each material. • Expressed as high, medium, low benefit per appliance. • Gross benefits = sum of all benefits under program scenario • Net calculated as gross benefits less baseline. Steps to Calculate NEB per unit
Majority of benefits come from GHG emissions • GHG benefits calculated by converting GHG emission to equivalent CO2 (global warming potential). • CO2cost taken from council’s forecast of CO2 prices • Cost $ 27 / ton in 2012. Per Unit NEB – Mid Scenario
Net NEBs are $ 53 for the mid scenario. • Inclusion of NEBs is dependent on the following questions: • Are re-sale costs of recovered material considered in the incremental cost of the measure? • What happens to the recovered refrigerant post recycling? • These NEBs are currently used to offset incremental measure cost. • Staff requests RTF guidance on how to account for these NEBs Decommissioning Per Unit NEB
Subcommittee met in April, did not reach consensus. • Staff proposal: R2 = 75 % • Justification on following slide. • Motion made to update R2 to 75% in April meeting. Result: 11 Yes, 1 No, 3 Abs. Motion needs 12 Yes to pass, did not have a quorum. • Presentation from April meeting available as backup slides. Brother In-Law/R2 Factor (history)
R2 = 75% • Justification: • Would-be non-opportunistic acquisitions are likely to get acquired anyway (i.e. R2 = 100%). • 55% could be the lower limit of R2, based on: • Initial Cadmus analysis from 4 extra-regional surveys estimates that 55 % of non-participant recycled units would have ended up as an non- opportunistic acquisition. • Assuming all would-be opportunistic acquisitions do not acquire a unit. • 100 % is the theoretical upper limit of R2. • Assuming all would-be opportunistic acquisitions do acquire a unit. • 75 % is in the middle. Staff Recommendation
New federal standard will be effective in 2015. • New refrigerators in 2015 may be more efficient than those available now. • Recycling refrigerators induces some early replacement. • In cases where a recycled refrigerator gets replaced with a new refrigerator, the program could lead to a less efficient replacement. • Should the analysis take this effect into consideration? • This issue applies to all early retirement measures. Early Retirement Treatment
Risk mitigation credit is the credit for system risk reduction due to conservation. • Should the risk mitigation credit be applied to a short lived measure? Risk Mitigation Credit
“I _________ move that the RTF approve the refrigerator and freezer decommissioning UES measures as proposed with a sunset date of June 2015.” Proposed Decision
Brother In Law Factor Presentation, RTF April Meeting. Backup Slides
Jaco: Bob Nicholas, Phil Sisson (Consultant) PSE: Bobbi Wilhelm KEMA: Ken Agnew Cadmus: Josh Keeling, Doug Bruchs CleaResult: Mark Jerome. RTF: Adam Hadley, Mohit Singh-Chhabra CADMUS: Doug Bruchs, Josh Keeling Avista: David Thompson. Subcommittee Meeting Attendees
As Per UMP: Percentage of the would-be acquirers of avoided transfers that found an alternate unit are referred to as “R2”. Note, Percentage of the would-be acquirers of avoided transfers that did not find an alternate unit are “(1-R2)”. Brother In Law Factor/ R2
R2 = 50% • Justification: • Midpoint between extreme values (0% and 100%) • We don’t know and can’t measure this factor accurately. • Votes: • Bob Nicholas (JACO) • Concerned that this factor needs to be studied more before we decide to modify it. R2 Option- 1 (UMP/ Status Quo)
R2 = 97 % • Justification: • Based on survey data. • Vote: • Bobbi Wilhelm (PSE) • “Concerned that because energy savings estimates feed into the adjusted load forecast for DSM that we would over adjust if not taking 97%. Need to be absolutely certain that savings exist because they impact how we plan for supply side and demand side resources. • “Worried that voting on savings vs. using best available data limits our ability to optimize our portfolio.” • David Thompson (Avista) • Agrees with Bobbi’s concern that we need to be certain about savings for load forecasting. R2 Option-2. (PSE Study)
R2 = 75% • Justification: • Would-be non-opportunistic acquisitions are likely to get acquired anyway (i.e. R2 = 100%). • 55% could be the lower limit of R2, based on: • Initial Cadmus analysis from 4 extra-regional surveys estimates that 55 % of non-participant recycled units would have ended up as an non- opportunistic acquisition. • Assuming all would-be opportunistic acquisitions do not acquire a unit. • 100 % is the theoretical upper limit of R2. • Assuming all would-be opportunistic acquisitions doacquire a unit. • 75 % is in the middle. R2 Option 3: Meet in the Middle
Votes: • Adam Hadley (RTF) • This is a very difficult thing to study; we’re close enough. • Mark Jerome (CleaResult) • Agree with above logic • Doug Bruchs & Josh Keeling (Cadmus) • Agree with above logic • Phil Sisson (JACO Consultant) • Provisionally agree with above logic – but want to review nonparticipant surveys and instruments. R2 Option 3: Meet in the Middle