Automating Plot Labels: Log-Log Subplot with String Labels for Data Visualization
50 likes | 161 Views
This guide demonstrates how to extract strings from a cell array for labeling in log-log subplots. It highlights the importance of utilizing text headers in imported data files for figure and axis labels. By addressing non-intuitive syntax and common challenges faced when working with string labels, this script provides a practical solution tailored for data visualization needs. Using the EPA NLA dataset, which includes water quality data from over 1000 lakes, the script enhances automation in graphing functions and streamlines the labeling process.

Automating Plot Labels: Log-Log Subplot with String Labels for Data Visualization
E N D
Presentation Transcript
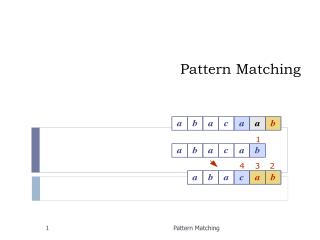
Skills Sharing:How to Log-Log subplot with strings as labels GLEON Fellowship Workshop January 14-18, 2013 Sunapee, NH Emily Kara Read
Strings as labels • This script is an example of how to pull strings (text) from a cell array to use as a label • For example, if you import a .txt file that has text headers, that text will not be recognized as data, but as strings. Those strings can be accessed for functions such as to make a figure label or axis label using the syntax described here
Skill relevance/usefulness • Seems so simple but non-intuitive • Didn’t know how to make labels from array of strings • Learned how to do and wrote a script for reference • Very handy because maximizes automation for scripting functions
Application to data • Used EPA NLA dataset as a example case • Water quality dataset from >1000 lakes all sampled in 2007 • Main challenges • Non-intuitive syntax • Hard to search for examples • Horizontal concatenation • title(labels{i});