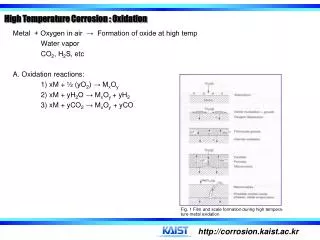
Download
1 / 13
130 likes | 278 Views
Transmittance Measurements of VUV Light as a Function of Water Vapor and Oxygen Concentrations. PHENIX Experiment, Brookhaven National Laboratory June - July 2004 G. Karagiorgi**, B. Azmoun*, C. Woody*, M. Hohlmann** *Brookhaven National Laboratory **Florida Institute of Technology.

E N D
Transmittance Measurements of VUV Light as a Function of Water Vapor and Oxygen Concentrations • PHENIX Experiment, Brookhaven National Laboratory • June - July 2004 • G. Karagiorgi**, B. Azmoun*, C. Woody*, M. Hohlmann** • *Brookhaven National Laboratory • **Florida Institute of Technology Florida Academy of Sciences 69th Annual Meeting Tampa, FL March 18, 2005
Purpose of Study: Reference for the Hadron Blind Detector (HBD), which is going to be employed at the PHENIX experiment at the Relativistic Heavy Ion Collider (RHIC) facility, at Brookhaven National Laboratory. Reference: http://www.phenix.bnl.gov/ Georgia Karagiorgi, FAS 2005
Introduction: Gas Cherenkov Detectors Detection of Cherenkov light v > c/n in medium (refraction index n) β = c/v cosφ=1/nβ Reference: http://encyclopedia.thefreedictionary.com/Cherenkov%20effect HBD Violet – Ultraviolet (VUV) light detection Georgia Karagiorgi, FAS 2005
Introduction: Gas Cherenkov Detectors: VUV Transmittance factors: • Gas Type ( radiator, transparent to desired λ ) • Out-gassing ( vessel material ) • Contaminant particles ( N2,O2, H2O vapor) Georgia Karagiorgi, FAS 2005
Study: Transmittance of VUV light as a function of H2O vapor and O2 concentrations Reference for water and oxygen levels that can be tolerated within such a detector before any significant fraction of VUV light is lost % Transmittance of VUV light in Ar gas vs. H2O [ppm] % Transmittance of VUV light in Ar gas vs. O2 [ppm] %T = (Flux out / Flux in)*100% Georgia Karagiorgi, FAS 2005
Method: Experimental Setup i sample %T = 100% i vacuum Reference: http://www.phenix.bnl.gov/phenix/WWW/publish/azmoun/Trans_O2_H2O.pdf Georgia Karagiorgi, FAS 2005
Theory: Theoretical Transmittance Interaction cross section,[Mbarn] Vs wavelength [Angstroms] for H2O I(x) = Io e -μx I(x=L) = Ioe –σNL I(x=L) = Ioe –σpNL I(x) : flux after the beam has traversed a distance x trough the absorber Io : initial flux μ : attenuation coefficient N : particle density (particles per cubic cm) L : total length through which the VUV beam travels σ : interaction cross section Reference: A.N. Zaidel’ and E.Ya. Shreider, Vacuum Ultraviolet Spectroscopy. Ann Arbor-Humphrey Publishers; Ann Arbor, London 1970 Attenuation coefficient, µ [cm-1] Vs wavelength [Angstroms] for O2 Reference: A.N. Zaidel’ and E.Ya. Shreider, Vacuum Ultraviolet Spectroscopy. Ann Arbor-Humphrey Publishers; Ann Arbor, London 1970 Georgia Karagiorgi, FAS 2005
Results: Transmittance in H2O vapor Plot 1: Transmittance spectra as a function of H2O levels Interaction cross section,[Mbarn] Vs wavelength [Angstroms] for H2O Reference: A.N. Zaidel’ and E.Ya. Shreider, Vacuum Ultraviolet Spectroscopy. Ann Arbor- Humphrey Publishers; Ann Arbor, London 1970 Georgia Karagiorgi, FAS 2005
Results: Transmittance in H2O vapor Plot 2: Transmittance data @1290 Angstroms Vs H2O levels, compared to the expected transmittance--calculated from the interaction cross section @1290s Angstrom, extracted from the theoretical data for attenuation coefficient. Georgia Karagiorgi, FAS 2005
Results: Transmittance in O2 Plot 3 Transmittance spectra as a function of O2 levels Attenuation coefficient, µ [cm-1] Vs wavelength [Angstroms] for O2 Reference: A.N. Zaidel’ and E.Ya. Shreider, Vacuum Ultraviolet Spectroscopy. Ann Arbor- Humphrey Publishers; Ann Arbor, London 1970 Georgia Karagiorgi, FAS 2005
Results: Transmittance in O2 Plot 4: Transmittance data @1450 Angstroms Vs O2 levels, compared to the expected transmittance--calculated from the attenuation coefficient @1450 Angstroms, extracted from the theoretical data for attenuation coefficient. Georgia Karagiorgi, FAS 2005
Conclusions • In agreement to previous experimental data • Provided reference for tolerable contaminant levels for • efficient operation of the HBD detector • Determined the necessity for good sealing Georgia Karagiorgi, FAS 2005
References • A. N. Zaidel and E. Ya. Shreider. Vacuum Ultraviolet Spectroscopy. Ann Arbor Humphrey Publishers; Ann Arbor, London; 1970. • B. Azmoun, G. Karagiorgi and C. Woody. Transmittance as a function of water and oxygen levels in the VUV regime. September, 2004. http://www.phenix.bnl.gov/phenix/WWW/publish/azmoun/Trans_O2_H2O.pdf • http://www.phenix.bnl.gov • http://www2.slac.stanford.edu/vvc/detectors/cerenkov.html Georgia Karagiorgi, FAS 2005