Download
1 / 7
70 likes | 173 Views
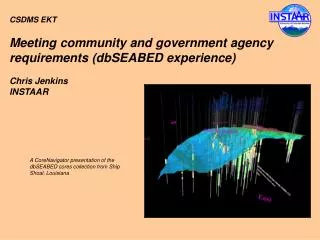
CSDMS EKT Meeting community and government agency requirements (dbSEABED experience) Chris Jenkins INSTAAR. A CoreNavigator presentation of the dbSEABED cores collection from Ship Shoal, Louisiana. dbSEABED: Inputs and Outputs.

E N D
CSDMS EKTMeeting community and government agency requirements (dbSEABED experience)Chris JenkinsINSTAAR A CoreNavigator presentation of the dbSEABED cores collection from Ship Shoal, Louisiana
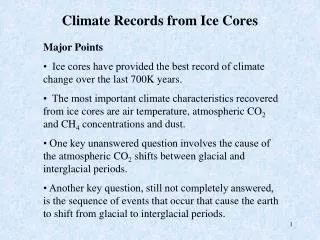
dbSEABED: Inputs and Outputs • Sediment character, physical properties, grain types, benthos and structures • Inputs sample, diver, image, probe data • Textures, composition, geoacoustic and sediment transport properties, feature and grain types • Outputs point and grid maps for any application - GIS, modeling, database
History of applications of dbSABED • Global sand-mud transition (George et al 2008) • Permeability and contaminants in shelf sands (Wiberg & Jenkins 2003) • Littoral carbonate reserves and ocean acidification (Gattuso et al., Villefranche, France) • Sediment mobility (Porter-Smith et al 2004) • Florida pink shrimp habitat suitability & conservation (Rubec et al 2005) • Modelling seafloor global change and infrastructure risks (Li et al 2005) • Deep cold coral habitat suitability (Leverette 2004) • Mine burial calibration Baltic Sea (Wever et al 2006) • Demersal shark habitat analysis, Adriatic Sea (Ferretti, Dalhousie Univ) • Global hard substrates distribution (The Nature Conservancy 2004) • US Gulf of Mexico hard substrates for Grouper stocks conservation (GSMFC 2005-) • Validation of statistical spatial resampling method (Goff et al., 2007) • National bioregionalization, Australia (Burne et al., 2003) • Seafloor geoacoustic properties for sonar prediction • Great Barrier Reef bioregionalization (RAP) leading to fisheries exclusions (Day et al 2000) • Marine aggregates estimation (Williams et al., 2006) • Search and rescue, Alaska Airlines 261 crash (USGS in 2000) • Great Barrier Reef resurvey design (Pitcher 2002) • Naval mines and MLO detectability in sea-lanes • Marine parks pre-commissioning survey, Victoria and NSW (1999, 2001) • National marine sanctuary surveys, California (Cochrane 2003, 2005) • Essential fish habitat (EFH) delineations, New England (2007) and others. My favourite is the RAP project which was pushed through the intense politics of fisheries and localism to achieve broad latitudinal no-fishing zones across the Great Barrier Reef. Fish and probably invertebrate stocks have rebounded strongly (e.g., Evans 2006), vindicating the zones.
What is required by ‘clients’ ? • Rapid response – many projects are time critical, especially in the political, commercial, and emergency arenas. • Coverage in their geographic region, and they they will compromise on attributes to achieve it. • They show a high emphasis on internal consistency; less emphasis/scrutiny on uncertainties. • Younger researchers are prepared to put in more time on data preparation, etc. They see the possibilities. • Searchable / browseable, information-sets so they can follow their thought-train and curiosity. • Integrated (harmonized) results - ie. information instead of data • Not so keen to trysoftware which can be a lot of trouble to them, especially if precise data inputs are needed.
A New Form of Visual AND Deep Data Presentation: Binned Results
Browseable Data Deliveries • It is very important to serve Data Presentations that hold the attention of Researchers and Students • Google Earth (KML) and Web GIS can do that • Options are: vector (point, polygon), grid, bin • dbSEABED is trying different information displays to answer the question for the public, research and clients: “What is the seabed like at Point X”
End References Most may be found in the dbSEABED bibliography: “http://instaar.colorado.edu/~jenkinsc/dbseabed/bibliography.htm” The others are: Evans, R.D., Williamson, D.H., Sweatman, H., Russ, G.R., Emslie, M., Cheal, and Miller, I., 2006. Surveys of the effects of rezoning of the GBR Marine Park in 2004 on some fish species – preliminary findings. Marine and Tropical Sciences Research Facility, Townsville, AUS. “http://www.rrrc.org.au/publications/downloads/rap-rezoning-trout-report.pdf”