Download
1 / 23
230 likes | 257 Views
This study analyzes the recent trends in water quality in Cannonsville Reservoir from 2002 to 2008 and explores the factors that may have influenced these trends. The results highlight the importance of watershed protection programs, precipitation patterns, and reservoir operations on water quality. The study also discusses the potential effects of reservoir drawdown on water quality and provides insights into the trends in the West Branch Delaware River. Overall, this research sheds light on the significance of monitoring and managing water quality in Cannonsville Reservoir.

E N D
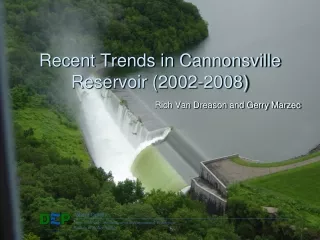
Recent Trends in Cannonsville Reservoir (2002-2008) Rich Van Dreason and Gerry Marzec Water Quality New York City Department of Environmental Protection Bureau of Water Supply
Road Map • Introduction • Objectives • Identify trends and important factors • Relevance • Why are we interested in Cannonsville Trends? • Background • Review of Watershed Protection programs • Site description • Watershed characteristics • Methods • Describe data utilized • Statistical tests • Results • Conclusions
Objectives • Identify and quantify recent trends in water quality analytes for Cannonsville Reservoir 2002-08 • Factors • Watershed protection activities • Precipitation patterns • Reservoir operations • Effects of reservoir draw down on WQ • Trends in the W. Branch Delaware River (WQ & flow)
Why should we be interested in Cannonsville WQ trends? • Important water supply • On daily average basis provides 7% of the customer demand • Used to maintain aquatic habitats and water supply in the Delaware River • Restoration Success Story • Early work (Wood 1979) indicated eutrophic conditions • In 1992, Watershed Protection Programs were implemented • By 2002 no longer considered phosphorus restricted • In 2004 taken off State impaired waters 303 (d) list
Cannonsville Basin Watershed Partnership Programs • Net effect : Nutrient and sediment reductions • verified by paired watershed experiment, model results and by past trend analysis
Basin Characteristics (90%) (4% (3%) (3%) • More agricultural acreage than any other basin in the New York City water supply
Reservoir Features • Began filling in 1963 • Max depth: 49m • Max storage: 96.7 BG (3rd) • Flushing rate: 2.6 per year • Outflows • Spill, release, West Delaware tunnel Reservoir Characteristics
Precipitation (inches) Annual Precipitation 1991-2008 • 18 % more precipitation in 2002-08 period
Precipitation (inches/month) Precipitation & Flow Trends CannonsvilleReservoir at dam Average monthly Flow (cfs) • No overall trends; uniformly high
Cannonsville Operational Trends No trend Avg. monthly elevation (feet) • Seasonal draw downs • Drawdown neg. affects WQ • (Effler and Bader 1998) No trend Total Spill (MG/month) No trend Total Diversion (MG/month) • Drought 2001 • Shutdown June 06 Diversion (MG/month) • 27% per yr increase • 2006-2008 increase from: • Changes in Federal, State releases • Storm mitigation releases 2006-07 • WQ effects? Total Release (MG/month)
Reservoir Release vs. WQ • Initial analysis indicates weak relationship • Even weaker for suspended solids, particulate phosphorus • Minimal effect on water quality and long-term trends
Reservoir Elevation vs. WQ • 2-phase relationship • No relationship when spilling • Initial decrease as elevation drops • Dilution ? • Increase below 1145 ft • Re-suspension-verified by process studies (UFI 1995-97) • Same pattern observed for: • Suspended solids, particulate phosphorus , Secchi depth • Ramifications • Expected WQ decreases maybe masked by increases imparted by drawdown
Turbidity • Clarity indicator • measures light scattering from inorganic and organic particles suspended in water • Primary sources • Snow melt and storm runoff especially over agricultural lands or disturbed areas • Efforts ongoing to reduce loads
West Branch Delaware River Cannonsville Reservoir Avg. 30 days prior • River • No overall turbidity trend • Turbidity peaks associated with snowmelt and summer storms • No summer events in 05, 07, 08 • Reservoir • Weak turbidity increase of 3% per yr. (0.1 NTU/yr) • June 06 storm primary factor • Snowmelt 05 and 07 secondary factors • Additional contribution from re-suspension • Drawdown • Low river input Cannonsville, June 06
Total Phosphorus • Primarily responsible for eutrophication • Primary sources: • Agricultural runoff, WWTP, septic failures • Efforts ongoing to reduce loads
West Branch Delaware River Cannonsville Reservoir =90 µg L-1 • Upstream site (WSPA) • Downstream site (WSPB) Avg. 30 days prior • Reservoir • Decrease of 3% per yr. overall • (0.6 µg L-1) • Down trend weakened by: • Algal uptake • Mar 05 snowmelt & Jun 06 flood • Re- suspension suspected : • Draw-down • Low river input • River • Decrease of 8.5% per yr. overall (2.1 µg L-1) • Elevated 2002 TP related to Walton WWTP • Decrease post 2002 from cumulative effects of Watershed Protection Program
Chlorophyll a • Indicator of algal biomass • Reductions in phosphorus Reductions in algae
Chlorophyll Trends • = 4 months (Jul-Oct) >35µg/L Cannonsville Reservoir West Branch Delaware River High values TDP associated w/ WWTP • Reservoir • Overall down trend of 7% per yr. (0.5 µg/L) • Driven by high CHLA in 2002-03 (assoc. w/ WWTP effluent) • Trend weakened by Jun 06 storm
Acknowledgements • Steve Schindler and Andrew Bader for review • Bradley Dromazos for background regarding reservoir operations • Dr. Dennis Helsel for statistical assistance • David Lounsbury for Maps • Edward Blouin for background/data on farm programs