Download
1 / 16
180 likes | 362 Views
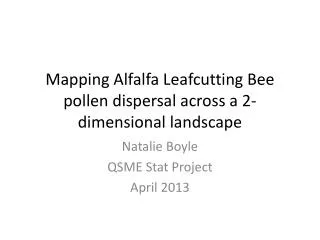
Mapping Autotetraploid Alfalfa. Joseph G. Robins and E. Charles Brummer. Objective. Determine the genetic basis of forage yield in alfalfa. Develop a genetic linkage map of tetraploid alfalfa. Map quantitative trait loci (QTL) associated with forage yield.

E N D
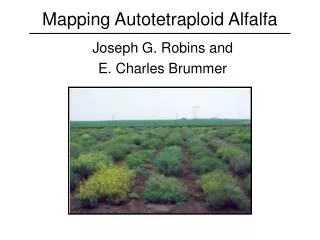
Mapping Autotetraploid Alfalfa Joseph G. Robins and E. Charles Brummer
Objective Determine the genetic basis of forage yield in alfalfa. • Develop a genetic linkage map of tetraploid alfalfa. • Map quantitative trait loci (QTL) associated with forage yield. • Implement a marker-assisted selection (MAS) program for alfalfa improvement. Robins and Brummer. CAIC. 2003.
Problem Lack of gain in alfalfa forage yield since the early 1980s. Courtesy: Riday and Brummer, 2002. Robins and Brummer. CAIC. 2003.
Autopolyploid Genetics Forage yield gain is complicated by the complexities of alfalfa genetics. • Complementary gene action (Bingham et al. 1994). • Irregular meiosis, when compared to diploids, with non-conventional segregation patterns. • Potential multivalent pairing. • Potential double reduction. Robins and Brummer. CAIC. 2003.
Our Approach A potential solution is to identify genomic regions associated with forage yield. • Create genetic map of a segregating population using molecular markers. • Combine marker and phenotype data to identify associations between markers and phenotype (QTL) • Utilize QTL in a marker-assisted breeding program to increase forage yield. Robins and Brummer. CAIC. 2003.
Experiment Created F1 mapping population by crossing WISFAL-6 (M. sativa subsp. falcata) x ABI-408 (M. sativa subsp. sativa). • Placed at Ames, IA, Nashua, IA & Ithaca, NY for forage yield analysis from 1999 - 2001. • Measurements were also taken for a variety of other traits. • Lsmeans across years and locations. Robins and Brummer. CAIC. 2003.
Forage Yield Results Population exhibits large amount of genetic variation for forage yield. • Broad-sense heritability = 0.57 ± 0.06. • H2 = σ2G / σ2P. Where σ2G =σ2A +σ2D +σ2F + σ2T + σ2I. • Based on entry means across years and locations. • Identified high and low transgressive segregants. Robins and Brummer. CAIC. 2003.
Genetic Mapping Developed a genetic map of the population using RFLPs, AFLPs, and SSRs. • Autopolyploid genetics complicate mapping. • Used RFLPs, AFLPs, and SSRs. • Single and double dose alleles. • Developed maps of both parents. Robins and Brummer. CAIC. 2003.
Mapping Summary Both parental maps are preliminary and currently composed of fourteen consensus linkage groups. • ABI-408: 120 RFLPs, 201 AFLPs, 7 SSRs • 179 single-dose, 32 double-dose, 120 distorted. • WISFAL-6: 106 RFLPs, 139 AFLPs, 4 SSRs • 115 single-dose, 50 double-dose, 84 distorted. Robins and Brummer. CAIC. 2003.
QTL Analysis Utilized single-marker analysis (ANOVA) to identify molecular markers significantly associated with forage yield. • ABI-408: Identification of three potential forage yield QTL. • WISFAL-6: Identification of two potential forage yield QTL. Robins and Brummer. CAIC. 2003.
Possible QTL Associations based on average forage yield (g plant-1) across locations and years. ParentMarkerYield (marker present/absent)P-value ABI-408 UGA189a 175 / 189 0.004 Vg2D11a 174 / 187 0.007 AGC/CAC216 177 / 195 0.0007 WISFAL-6 Vg2D11 186 / 169 0.005 UGA83 185 / 168 0.007 Robins and Brummer. CAIC. 2003.
AGC/CAA141 AGC/CTC120 UGA189a 0.0 0.0 0.0 AGC/CAG276 15.3 AGC/CAG141 18.8 UGA246 22.6 33.9 AGC/CTT162 AGC/CAA288 35.2 46.5 AGC/CAA201 ACG/CAA380 49.5 UGA543 53.8 58.3 ACG-CTC177 AGC/CAA230 63.0 65.3 UGA522b 64.0 ACG/CAT433 ACG/CAC227 69.8 AGC/CAC296 76.9 AGC/CAA253 75.9 ACG/CTG325 81.8 ACG/CAT155 83.5 AGC/CAC216 85.2 MS14 86.5 UGA286 89.5 100.9 UGA564 ACG/CAT467 97.5 UGA1208 ACG/CTA156 105.4 102.6 107.1 Vg2D11a AGC/CAC201 102.8 ACG/CTG283 107.9 UGA328 AGC/CAC230 111.6 111.3 121.6 AGC/CAG241 121.6 AGC/CAC251 UGA5 124.5 126.6 UGA189b AGC/CAC366 127.8 ACG/CAT283 129.1 ACG/CAT264 135.2 AGC/CAG239 133.5 AGC/CAG304 135.7 AGC/CAC177 147.4 ACG/CAC130 156.0 AGC/CAC148 173.6 ABI-408 QTL Mapping Markers (highlighted in red) associated with forage yield in the sativa parent. Only three of fourteen consensus linkage groups shown. Robins and Brummer. CAIC. 2003.
UGA85b UGA380 0.0 0.0 Vg2D11 15.4 UGA219 32.7 40.2 ACG/CTG211 ACG/CTA142 54.2 60.1 ACG/CTG277 afctt1 63.7 AGC/CTT167 62.7 ACG/CAC324 65.7 UGA28 74.6 UGA744 73.4 UGA449 82.1 UGA792 88.4 afct45 84.9 92.3 UGA189a UGA671 99.2 106.5 UGA83 MSAICB 103.9 RC2B-63BV8 110.1 109.5 RC-1-51dT23V20 110.3 ARC3D6 UGA540 116.1 afct32 127.6 AGC/CTT175 136.1 161.2 ACG/CTG122 AGC/CTT276 180.7 WISFAL-6 QTL Mapping Markers (highlighted in red) associated with forage yield in the falcata parent. Only two of fourteen consensus linkage groups shown. Robins and Brummer. CAIC. 2003.
QTL x Environment Our next step will be to analyze QTL as they change over the different locations and years. • The extent of our phenotypic data will allow us to identify QTL that are specific to individual locations, years, or location/year combinations. • This should allow us to identify QTL that are important in the developmental process of alfalfa (as the plant ages, it is possible that QTL may change) and QTL that are or are not influenced by environmental factors. • We hope to have results from these analyses shortly. Robins and Brummer. CAIC. 2003.
Summary We have: • Developed preliminary linkage maps of ABI-408 and WISFAL-6. • We are continuing to add SSRs. • Used single-marker analysis to identify potential QTL associated with forage yield in both parents. • Associations will be further verified with permutation testing. • We then hope to incorporate the results for alfalfa forage yield improvement. Robins and Brummer. CAIC. 2003.
Acknowledgements Dr. Charlie Brummer Dr. Diane Luth Dr. Heathcliffe Riday Meenakshi Santra Baldomero Alarcón-Zúñiga ISU-Forage Breeding Group Iowa State University Plant Science Institute USDA-NRI Competitive Grants Program Robins and Brummer. CAIC. 2003.