Download
1 / 27
320 likes | 541 Views
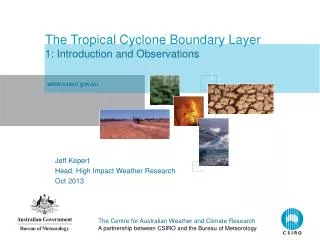
The Tropical Cyclone Boundary Layer 1: Introduction and Observations. www.cawcr.gov.au. Jeff Kepert Head, High Impact Weather Research Oct 2013. The boundary layer - definition.

E N D
The Tropical Cyclone Boundary Layer1: Introduction and Observations www.cawcr.gov.au Jeff Kepert Head, High Impact Weather Research Oct 2013
The boundary layer - definition The boundary layer is the lowest 1-2 km of the atmosphere, the region most directly influenced by the exchange of momentum, heat and water vapour at the earth’s surface. Turbulent motions on time scales of an hour or less dominate the flow in this region, transporting atmospheric properties both horizontally and vertically through its depth. The mean properties of the flow in this area – the wind speed, temperature and humidity – experience their sharpest gradients in the first 50 – 100 m, appropriately called the surface layer. Turbulent exchange in this shallow layer controls the exchange of heat, moisture and momentum at the surface and therefore the state of the whole boundary layer. Kaimal and Finnegan (1994) The Centre for Australian Weather and Climate ResearchA partnership between CSIRO and the Bureau of Meteorology
Hurricane Guillermo (1997) The Centre for Australian Weather and Climate ResearchA partnership between CSIRO and the Bureau of Meteorology
Importance of the TC BL • We live in the boundary layer • Potential intensity theory • Energy source (latent and sensible heat flux) • Energy sink (frictional dissipation) • Ocean response • Waves • Storm surge • Major hazards, often more so than wind (e.g. Katrina) • Engineering design, characteristics of the mean winds and turbulence • Definition of cyclone intensity The Centre for Australian Weather and Climate ResearchA partnership between CSIRO and the Bureau of Meteorology
Structure of lecture series • Introduction, observed structure • Dynamics of the tropical cyclone boundary layer • More on the dynamics • Thermodynamics • Air-sea fluxes and turbulence • Secondary eyewalls and the boundary layer The Centre for Australian Weather and Climate ResearchA partnership between CSIRO and the Bureau of Meteorology
Surface winds in Hurricane Frederic • Maximum winds in right forward quadrant • Maximum inflow angle to right rear, sometimes weak outflow to left • Mean inflow angle 20 – 25o • Powell (1982, MWR) 5 m s-1 The Centre for Australian Weather and Climate ResearchA partnership between CSIRO and the Bureau of Meteorology
NW Pacific Typhoon, Japanese Navy Arakawa and Suda (1953, MWR) The Centre for Australian Weather and Climate ResearchA partnership between CSIRO and the Bureau of Meteorology
Waves in the Typhoon Arakawa and Suda (1953, MWR) The Centre for Australian Weather and Climate ResearchA partnership between CSIRO and the Bureau of Meteorology
Wright et al. 2001, JPO The Centre for Australian Weather and Climate ResearchA partnership between CSIRO and the Bureau of Meteorology
Surface Wind Factor • The surface wind factor is the ratio of the surface wind speed to that at some higher level • Typically to gradient wind equation, or to observed flight level winds • Traditional values range from 0.7 – 0.8 • Widely used • to estimate surface winds from aircraft data • as a very crude parameterisation of the boundary layer for storm surge or wind risk modelling The Centre for Australian Weather and Climate ResearchA partnership between CSIRO and the Bureau of Meteorology
Surface vs gradient winds • Typhoon Vera, 1977 • Observations from flat coral atoll, south of Japan • Significant variation in surface wind factor near eyewall • Rapid reduction in radial flow near eyewall • Mitsuta, Y., T. Suenobu and T. Fujii, 1988: Supergradient surface wind in the eye of a typhoon. J. Meteor. Soc. Japan, 66, 505-508. Mitsuta et al. (1988) The Centre for Australian Weather and Climate ResearchA partnership between CSIRO and the Bureau of Meteorology
Winds in Hurricane Katrina Powell et al. (2009) The Centre for Australian Weather and Climate ResearchA partnership between CSIRO and the Bureau of Meteorology
SWF from buoy and aircraft data Powell and Black (1990, JWEIA) The Centre for Australian Weather and Climate ResearchA partnership between CSIRO and the Bureau of Meteorology
Azimuthal Hurricane Mitch: Mean Winds by Annulus 25-40km 40-100km • Speed maximum below 500 m inside RMW. • Increases rapidly in height across RMW. • In 15-25 km band, max shear in layer above jet. • Strongest inflow near RMW, with marked outflow above. • Kepert (2006b) 0-15km Azimuthal Wind 15-25km Radial 15-25km 40-100km 25-40km Radial Wind 0-15km The Centre for Australian Weather and Climate ResearchA partnership between CSIRO and the Bureau of Meteorology
Variation in wind structure within storm • Mean wind profile in many hurricanes from dropsonde observations • Normalised by 700-hPa wind • Substantial difference between eyewall and outer vortex • Franklin et al (2003, W&F) The Centre for Australian Weather and Climate ResearchA partnership between CSIRO and the Bureau of Meteorology
SWF’s from dropsonde data Franklin et al. (2003, W&F) The Centre for Australian Weather and Climate ResearchA partnership between CSIRO and the Bureau of Meteorology
Interstorm variability • Mean normalised wind speed profiles in the eyewall of seven hurricanes • Significant differences between storms • Structure of profile • Surface wind factor 0.82 to 0.96 • Franklin et al (2003, W&F) 0.82 0.96 The Centre for Australian Weather and Climate ResearchA partnership between CSIRO and the Bureau of Meteorology
The logarithmic surface profile • Below the wind maximum, the mean wind profile is approximately logarithmic • Slight curvature in lowest 20 – 30 m • Franklin et al (2003, W&F) The Centre for Australian Weather and Climate ResearchA partnership between CSIRO and the Bureau of Meteorology
Radius-height sections Max. updraft Frank (1984) The Centre for Australian Weather and Climate ResearchA partnership between CSIRO and the Bureau of Meteorology
Hurricane Fabian cross-sections • Hurricane Fabian mean axisymmetric wind on 3 days • Dropsonde and Doppler radar data • Shading: mean azimuthal wind • Arrows: radial and vertical flow • Contours: radial flow at 5 m/s intervals • Bell et al. (2012, JAS) The Centre for Australian Weather and Climate ResearchA partnership between CSIRO and the Bureau of Meteorology
Hurricane Isabel cross-sections • Hurricane Isabel mean axisymmetric wind on 3 days • Dropsonde and Doppler radar data • Shading: mean azimuthal wind • Arrows: radial and vertical flow • Contours: radial flow at 5 m/s intervals • Bell et al. (2012, JAS) The Centre for Australian Weather and Climate ResearchA partnership between CSIRO and the Bureau of Meteorology
Composite r-z sections Obs show that the well-mixed (constant θ) layer is half or less the depth of the inflow layer in TCs. Zhang et al (2011, MWR) composite r-z sections in N Atlantic hurricanes. Azimuthal wind Potential temperature Radial wind Top of inflow layer The Centre for Australian Weather and Climate ResearchA partnership between CSIRO and the Bureau of Meteorology The Centre for Australian Weather and Climate ResearchA partnership between CSIRO and the Bureau of Meteorology
The Centre for Australian Weather and Climate ResearchA partnership between CSIRO and the Bureau of Meteorology Photo: Frank Marks, HRD
The Centre for Australian Weather and Climate ResearchA partnership between CSIRO and the Bureau of Meteorology Photo: Frank Marks, HRD
Observations • Heavy reliance on research aircraft • Doppler radar • Tail-mounted, horizontal axis, forward-and-aft scanning (FAST) • Step frequency microwave radiometer (SFMR) • Downward-looking, passive microwave, 6 frequencies • Emissivity depends on white cap fraction, which depends on wind speed • Extensive calibration against dropsonde and buoy data • Uhlhorn and Black (2003, J.Tech) • GPS Dropsonde • Radiosonde-like package dropped from aircraft • Measures wind, p, T, q at 2 Hz (~ 6 m vertical resolution) • Revolutionised understanding of boundary layer in tropical cyclones • Hock and Franklin (1999) • Data is available from the HRD website http://www.aoml.noaa.gov/hrd/ The Centre for Australian Weather and Climate ResearchA partnership between CSIRO and the Bureau of Meteorology
P3 Dropsonde Workstation The Centre for Australian Weather and Climate ResearchA partnership between CSIRO and the Bureau of Meteorology Photo: Frank Marks, HRD
Summary • Max winds in right forward quadrant • Low level jet • Strong inflow near surface, strong updraft at eyewall, outflow aloft • Variation within and between storms • Logarithmic profile near surface The Centre for Australian Weather and Climate ResearchA partnership between CSIRO and the Bureau of Meteorology