Download
1 / 43
500 likes | 802 Views
Learn about ocean and air cargo handling and containerization in international logistics. Compare domestic vs. international logistics, explore port operations virtually, and understand the complexities involved in transportation modes and distances.

E N D
Ocean and Air: Cargo Handling and Containerization International Logistics
Learning Objectives • Compare Domestic with International Logistics • Provide accessible overview of Ocean and Air Cargo Handling and Containerization • “Virtual” Picture Tour of Port Operations and Containerization
Domestic Vs. International Logistics US Bank US Seller Seller Export Facilitators US Government Agencies Domestic Inland Carrier Transportation Carrier US Port of Exit Ocean/Air Carrier Buyer Foreign Port of Entry Foreign Government Agencies Foreign Inland Carrier Movement of Goods Information Flows Foreign Bank Buyer
Domestic Vs. International Logistics Domestic International Estimated at 16% of world GDP today Mainly ocean and air, with significant intermodal activity Higher levels, reflecting longer lead times and greater demand and transit uncertainty Heavy reliance on forwarders, consolidators, and customs brokers High, due to differences in currencies, inflation levels and little recourse for default High, due to longer/more difficult transit, frequent cargo handling, and varying levels of infrastructure development Cost Transport mode Inventories Agents Financial risk Cargo risk About 10% of U.S. GDP today Mainly truck and rail Lower levels, reflecting short-order, lead-time requirements and improved transport capabilities Modest usage, mostly in rail Low Low
Domestic Vs. International Logistics II Domestic International Many agencies involved (e.g., customs, commerce, agriculture, transportation Significant paperwork; the U.S. Voice and paper costly and often ineffective; movement toward electronic interchange but variations in standards hinder widespread usage Cultural differences require significant market and product adaptation Government agencies Administration Communication Cultural differences Primarily for hazardous materials, weight, safety laws, and some tariff requirements Minimal documentation involved (e.g., purchase order, bill of lading, invoice) Voice, paper-based systems adequate, with growing usage of electronic data interchange and Internet Relative homogeneity requires little product modification
Features of International Logistics • Complex Distances & Transportation Modes • Ocean & Air transport more common than for domestic flows • Shipping: 1998: 30% of U.S. exports by value, down from 40% in 1988 • Airfreight • Governments often regulate which carriers can be used, especially for sales to the government • Must factor-in total carrying costs including delays, port storage time, warehouse inventory and exchange rate changes • Global Operations and Product Customization (at order /shipping point or in local environment) Complicated Logistical Systems
Brainstorming Session • (Obvious) Differences exist between ocean and air cargo transportation. • Define the factors that characterize these differences • Identify these differences
Air Freight/Cargo • Significant Part of Aviation Industry: Est. Revenues of $49.5bn in 2005 • < 1% Domestic (By weight) • ~ 2% International (By weight) • > 30% International (By value): Total value of goods = US$3.25 trillion (35.6% est). • International air freight volume growth slowed significantly in 2005, falling from 13.4% in 2004 to 3.2% in 2005 • Air freight share reduced slightly in previous years: Recent strong increases in prices of commodity goods (e.g. oil) transported by surface modes • Region-specific signs of recovery: Major Asian; North American; and Large European markets
Advantages of Air Transportation for International Logistics • Speed • Wider Market Areas • Advantageous over Surface Transportation Systems (congestion, poorly developed infrastructure, etc.) • Air-appropriate goods: Define Characteristics?
Air Transportation - Conducive Business Characteristics • High-Value, Low-Bulk Cargo • “JIT” Inventory Management Practices • Lean Production Methods • Short(er) Order Cycle times • Globalization: Impact on Sourcing, Production and Logistics Practices • Outsourcing – International Contract Manufacturing Alliances • Commercial Development of Emerging Economies
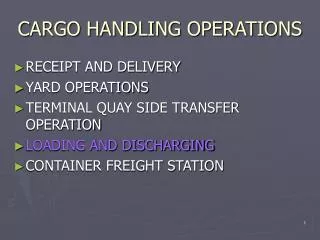
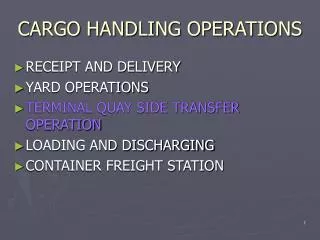
Ocean Shipping Cargo Handling • Transfer of Cargo in and out of Ship’s Holds • Handling Cargo on Dock • Transfer of Cargo to Ground Transportation and Stowage • Determines vessel’s turnaround time in Port earning power • Historically Manual (Longshoremen OR Stevedores) • Today Mechanical – Optimized Cargo Stowage Programs
Cargo Handling Equipment • Yard trucks (hostlers) • Cranes • Top and side handlers • Forklifts • Loaders, etc
Cargo Handling Methods • Crane/Conveyor Combi (Dry Bulk Cargo) • Pipeline (Liquid Bulk cargo) • Breakbulk Cargo • Palletized • LO/LO (Crane lifted) • RO/RO (Automobiles and equipment - Driven Cargo) • Containers (>54% of all cargo)
Containerization • Unitization/Consolidation of multiple units • System of intermodal freight/cargo transport • Standard containers can be loaded and sealed intact onto ships, railcars, planes and trucks • Improves efficiency, protects materiel, reduces handling & pilferage • Varying Sizes (ft) (Ocean):8x8x40; 8x8x20; 8x8x10; 8.5x9.5x40 • Standard Conversion Units/Sizes: 20 ft (TEU) or 40 ft (FEU) • Shorter to permit multiple units on railcars
Containerization - History History - 26th April 1956: The ideal–X. • Trucking entrepreneur Malcom McLean put 58 containers aboard a refitted tanker ship, the “Ideal-X”" and sailed them from Newark to Houston • Had watched teams of dock workers unloading goods from trucks and transferring them to ships and came up with a more efficient way • Refitted two oil tankers and designed truck containers that could be stacked on or below their decks • Significant growth during Vietnam War
Containerization - Today • No. of containers worldwide: 22 million • Number of container ships worldwide: 7,936 • Container traffic: >116 million TEUs • Value of Container Shipping:>$6.5 trillion • Worldwide container traffic grows by average of ~ 13% since 2003 • Infrastructure beginning to ‘creak’ under the strain
Top 10 container shipping companies in order of TEU capacity, 2006
“Virtual Picture” Tour No substitute for the real thing – JAXPORT Tour!
Double-stack Containerization • Most flatcars cannot carry more than one standard 40 foot container • BUT, a well car can accept a container and still leave enough clearance for another container on top, on most North American rail routes that do not have overhead electric power • American President Lines introduced this "double stack" principle under the name of "Stacktrain" rail service in 1984 • It saved shippers money and now accounts for almost 70 percent of intermodal freight transport shipments in the US
A container ship being loaded by a Portainer (Container Crane) in Copenhagen Harbour
Twistlocks: Capture and constrain containers. Forklifts designed to handle containers have similar devices.
Shipping Containers at the terminal at Port Elizabeth, New Jersey
Pier T Container Terminal in Long Beach, Ca.Intermodal rail in the foreground and gantry cranes behind
Container ship "Rita" being loaded at Copenhagen by a Portainer
Self taken picture of a Roll-On Roll-Off (RO-RO) ship with ship's name removed to avoid any conflicts
Figure 15-1:Loading a Travel Trailer Aboard a RO/RO Vessel in the Port of Seattle
Examples of Different Containers 45 ft High cube 8 X 8.5X20 ft Flatrack Open top Refrigerated
Container Population and Costs • Grew from 3.5M TEU in 1983 to approx 10.5M TEU population in 1997 • Growth rate of 7% compounded annually • 60% of growth due to expansion • 40% for replacement • Ocean carriers spend $1.8B/yr on new containers • 20% of containers moved on ships are empty—costing ocean carriers an estimated $3B/yr in handling fees
Unit Load Devices (ULDs) • Pallets and containers used to load luggage, freight, and mail on wide-body aircraft and specific narrow-body aircraft • Benefits: • Fewer units to load • Saves ground crews time and effort • Helps prevent delayed flights • Contents can be tracked since each ULD is manifested separately • Come in 2 Forms: • Pallets: Rugged sheets of aluminum with rims designed to lock onto cargo net lugs • Containers: • Also known as Cans and Pods • Fully enclosed containers made of aluminum or combination of aluminum (frame) and plastic (walls) • May have refrigeration units built-in depending on nature of goods inside • Aircraft loadings can be made up of all containers, all pallets, or a mix of ULD types, depending on convenience
Ocean Ports - Exercise • Consider the table “World Port Rankings -2002” which follows the assigned reading Chapter 13 by Thomchik. • Explain the difference between the table components “Total Cargo Volume, Metric Tons (000s)” and “Container Traffic (TEUs, 000). • Next, consider “Table 25 (Top 20 Foreign Trade Freight Gateways by Value of Shipments: 2002)” which focuses on USA gateways. Print out a USA map and plot the location of the 20 gateways on the map. • What observations can you make from the plotted map with respect to the type and mix of the modal gateways, geographic locations, economic development and impact, etc.?
Comparison of Transportation Modes(US Domestic) Economic Characteristics
Comparison of Transportation Modes(US Domestic) Service Characteristics
Cost Factors Often Considered inMode/Carrier Selection • Freight costs • Inventory carrying costs • inventory in pipeline • cycle stock at the receiving location • required safety stock at the receiving location • Investment cost required to produce the inventory to fill the pipeline
Service Factors Often Considered in Mode/ Carrier Selection • Perceived quality of customer service • Shipment tracking and tracing capabilities • Billing/invoicing accuracy • Electronic data interchange (EDI) capabilities • Potential to develop mutually beneficial long-term partnership • Cargo capacity limitations • Ability to provide service that does not damage goods in transit • Customs clearance capabilities for international shipments • Impact on the shipper’s negotiating position/leverage on other shipping activities
Cost-of-Service Pricing Establishes rates at levels that cover carriers’ fixed and variable costs + profit margin Establishes lower limit of transportation rates (the price ‘floor’) Value-of-Service Pricing Maximizes Carriers’ revenues Market/Competition-driven Establishes upper limit of transportation rates (the price ‘ceiling’) Cost Structures II
Total Logistics Cost Analysis – Ocean vs. Air • Factors to consider (Table 11-3) • The Higher the Value : Weight ratio, the more likely justification for Air Cargo