Modeling Real-World Data
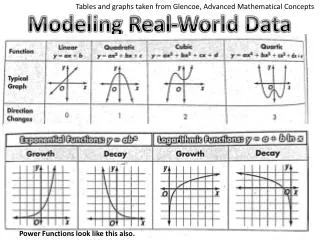
Tables and graphs taken from Glencoe, Advanced Mathematical Concepts. Modeling Real-World Data. Power Functions look like this also. STATPLOT – to look at shape of scatter plot data Put data in L1 & L2 STAT PLOT (2 nd Y=) 1: Plot1 ENTER ON ENTER Type: choose 1 st choice (scatter plot)

Modeling Real-World Data
E N D
Presentation Transcript
Tables and graphs taken from Glencoe, Advanced Mathematical Concepts Modeling Real-World Data Power Functions look like this also.
STATPLOT – to look at shape of scatter plot data • Put data in L1 & L2 • STAT PLOT (2nd Y=) • 1: Plot1 ENTER • ON ENTER • Type: choose 1st choice (scatter plot) • Xlist: L1 • Ylist: L2 • Mark: choose 1st choice
Coefficient of Determination “r2” • R2 near 1.0 indicates that a regression line is a “good fit” • R2 closer to 0 indicates a regression line is not a “good fit” • Indicates the proportion of variability that can be attributed to the statistical model • Indicates how accurate the model should be when used for predicting future outcomes Models are typically most accurate for finding values within the range of the given data – called interpolation. When extrapolating, finding measures outside the range of the given data, use extra caution in considering reliability.
Let’s look back at the data set we used previously, where x = 3 represents the school year 1983-1984. For this data we found the following linear regression: • Compare each and decide which is most representative – or best-fit model for the data • Quadratic Regression (5:QuadReg) • Cubic Regression (6:CubicReg) • Quartic Regression (7:QuartReg) • Exponential Regression (0:ExpReg) • Power Regression (A:PwrReg)
Let’s look back at the data set we used previously, where x = 3 represents the school year 1983-1984. For this data we found the following linear regression: • Compare each and decide which is most representative – or best-fit model for the data • Quadratic Regression (5:QuadReg) • Cubic Regression (6:CubicReg) • Quartic Regression (7:QuartReg) • Exponential Regression (0:ExpReg) • Power Regression (A:PwrReg) Notice that two of these have an r2 of .99 or better. You should ALWAYS check the graphs of the regression models against the actual data to know for sure. On the next slide we will learn how to do this. It is a Power Regression
Let’s look back at the data set we used previously. For this data we found the following linear regression: • Compare each and decide which is most representative – or best-fit model for the data • Quadratic Regression (5:QuadReg) • Cubic Regression (6:CubicReg) • Quartic Regression (7:QuartReg) • Exponential Regression (0:ExpReg) • Power Regression (A:PwrReg)
Let’s look back at the data set we used previously, where x = 3 represents the school year 1983-1984. For this data we found the following linear regression: • Compare each and decide which is most representative – or best-fit model for the data • Quadratic Regression (5:QuadReg) • Cubic Regression (6:CubicReg) • Quartic Regression (7:QuartReg) • Exponential Regression (0:ExpReg) • Power Regression (A:PwrReg) Graph to see if you still agree. It is a Cubic Regression
Graph to decide which is most representative – or best-fit model for the data • Linear Regression (4:LinReg) • Quadratic Regression (5:QuadReg) • Cubic Regression (6:CubicReg) • Quartic Regression (7:QuartReg) • Exponential Regression (0:ExpReg) • Power Regression (A:PwrReg) When looking at the graph you see that the data only changes direction one time, indicative of a quadratic function. Because quadratic, cubic, and quartic all have such high r2 values, it is critical that you see which one most closely mimics the graph.
Graph to decide which is most representative – or best-fit model for the data • Linear Regression (4:LinReg) • Quadratic Regression (5:QuadReg) • Cubic Regression (6:CubicReg) • Quartic Regression (7:QuartReg) • Exponential Regression (0:ExpReg) • Power Regression (A:PwrReg) When looking at the graph the data does not appear to change direction at all, i.e. there is no curve to the data, indicative of a linear function. Since all have such high r2 values, it is critical that you see which one most closely mimics the graph.
Graph to decide which is most representative – or best-fit model for the data • Linear Regression (4:LinReg) • Quadratic Regression (5:QuadReg) • Cubic Regression (6:CubicReg) • Quartic Regression (7:QuartReg) • Exponential Regression (0:ExpReg) • Power Regression (A:PwrReg) Notice how close the r2 values for the cubic and quartic regression equations are. When we check the graph we also see that the data changes direction 2 times, indicative of a cubic function.
If % put in as decimals, 23% as 0.23 If % put in as whole numbers, 23% as 23 Approximately 20%
31.6 million Approximately 18 years after 1983, so 2001.
In what year would the population have been 10 (in 100 millions)? In what year would the population have been 20 (in 100 millions)? In what year would the population be 30 (in 100 millions)? Find the expected population in 2070. Find the expected population in 2030. Approximately 47 years after 1950, or 1997. Approximately 79 years after 1950, or 2029. Approximately 98 years after 1950, or 2048. Approximately 48.7 in 100 millions, or 4.9 billions. Approximately 20.4 in 100 millions, or 2.04 billions.
How many hours will it take for there to be 50 bacteria (thousands/cc)? How many bacteria (thousands/cc) will there be after 15 hours? How many hours will it take for there to be 60 bacteria (thousands/cc)? How many bacteria (thousands/cc) will there be after 12.5 hours? Approximately 12.5 hrs. Approximately 75.73 (thousands/cc). Approximately 13.6 hrs. Approximately 50.40 (thousands/cc).
How many minutes will it take for the grams of U-239 to be present to have dropped to 2.3 grams? How many grams of U-239 will be present after 27 minutes? How many minutes will it take for the grams of U-239 to be present to have dropped to 1.5 grams? How many grams of U-239 will be present after 40 minutes? Approximately 49 minutes Approximately 63 minutes Approximately 4.44 grams Approximately 3.00 grams
How many total hours will it take for the number of bacteria (in millions) to have doubled from that observed at 4 hours? How many bacteria (in millions) will be present after 2.5 hours? How many hours will it take for the number of bacteria to reach 200 (in millions)? How many bacteria (in millions) will be present after 5.6 hours? Approximately 6.5 hours Approximately 1.3 more hours, at t = 5.3 hours. Approximately 20 Approximately 117
How many minutes will it take for the number of number of grams of Pb-211 present to reach 0.20? How many grams of PB-211 will be present after 45 mins? What is the half-life of PB-211 in minutes? How many grams of PB-211 will be present after 1 hour? Approximately 36 minutes Approximately 82 minutes Approximately 0.42 grams Approximately 0.31 grams
How much would have been in the account on January 1, 1965? How much would have been in the account on January 1, 1975? How much would have been in the account on January 1, 1985? How much would have been in the account on January 1, 1995? How much would have been in the account on January 1, 2005? How much would have been in the account on January 1, 2015? How many years will it take in all for the balance to reach$75,000? How many years will it take in all for the balance to reach $100,000? Approximately $3595.40 Approximately $28,779 Approximately $6047.50 Approximately $48,407 Approximately $10,172 Approximately 68.4 years Approximately $17,110 Approximately 74 years