Modeling Real-World Data
90 likes | 119 Views
Modeling Real-World Data. Essential Questions. How do we apply functions to problem situations? How do we use mathematical models to make predictions?. Holt McDougal Algebra 2. Holt Algebra 2.

Modeling Real-World Data
E N D
Presentation Transcript
Modeling Real-World Data Essential Questions • How do we apply functions to problem situations? • How do we use mathematical models to make predictions? Holt McDougal Algebra 2 Holt Algebra 2
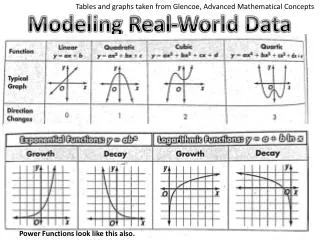
When data are not ordered or evenly spaced, you may to have to try several models to determine which best approximates the data. Graphing calculators often indicate the value of the coefficient of determination, indicated by r2 or R2. The closer the coefficient is to 1, the better the model approximates the data.
Helpful Hint To display the correlation coefficient r on some calculators, you must turn on the diagnostic mode. Press , and choose DiagnosticOn.
Economic Application A printing company prints advertising flyers and tracks its profits. Write a function that models the given data. Step 1 Make a scatter plot of the data. The data appear to form a quadratic or exponential pattern. Check the correlation coefficient of both equations to see which is a better fit.
Modeling Functions Write a function that models the given data. Step 1 Make a scatter plot of the data. The data appear to form a quadratic or exponential pattern. Check the correlation coefficient of both equations to see which is a better fit.
Economic Application The data shows the population of a small town since 1990. Using 1990 as a reference year, write a function that models the data. Step 1 Make a scatter plot of the data. The data appear to be quadratic, cubic, or exponential. Check the correlation coefficient of all equations to see which is a better fit.
Economic Application Write a function that models the data. Step 1 Make a scatter plot of the data. The data appear to be quadratic, cubic, or exponential. Check the correlation coefficient of all equations to see which is a better fit.