Download
1 / 43
440 likes | 512 Views
Explore the impact of Non-Tariff Barriers on international trade policies, categories of NTBs, trade intervention mechanisms, effects of import and export quotas. Learn about voluntary export restraints, export subsidies, production subsidies, dumping, and other non-tariff measures.

E N D
International Economics Session 4 : Trade Intervention Mechanism (Non-Tariff Barriers) Faculty: Prof. Sunitha Raju Session Date: 20.05.2012
Non-Tariff Barriers (NTBs) Definition Trade policy instruments, other than tariffs, that restrict market access or distort trade. 2.Reasons To protect industry from competition Not amenable to disciplining or reduction Can be applied in a discriminatory manner
Major Categories of Non-Tariff Measures Quantitative restrictions (Import quotas, export restrictions, Licensing, VER etc) Non-tariff charges (Variable levies, Anti dumping duties, Countervailing duties etc) iii) Government participation in trade (State trading, Govt. procurement, competition policies etc) iv) Customs procedures (Customs valuation, customs classification, customs clearance) Technical barriers to trade (Health & sanitary regulations, safety standards, labelling etc)
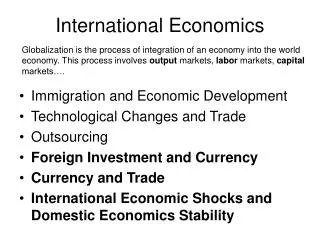
Market Effects of Import Quota: Small Country PY Sd Quota E P1Y g C c e f P0Y Dd Y0 Y2 Y1 Y3 Y O • Domestic prices higher than world prices • Quota increases domestic production and reduces domestic consumption • Quota rents captured by producers
Market Effects of Import Quota: Large Country • Fall in consumption (imports) leads to fall in world price - Export price of Country B falls • Deadweight loss of exporting country equals quota rents of suppliers in importing country • To reduce the negative welfare effects, countries employ VER • VER allows the exporting country to capture quota rents
Auction (govt. earns revenue) First come first serve (Nobody earns due to transactions costs)) Historical basis (Producer gains) Monopoly power (Importer/producer) Administration of Quota
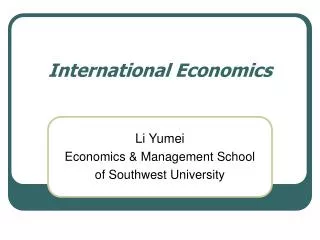
Tariff vs. Quota D´ P (Domestic Supply) S . P1 = Equilibrium price t(P3 – P2) : tariff equivalent gh: import quota D’: New demand curve P1 k j P4 f e i P2 c d P3 t l m q n r (Domestic demand) D Q 0 a g h b • Under rising demand, tariff results in higher imports but quotas result in higher prices. • In tariff, government earns revenue. In quota, the rents are appropriated by the producers.
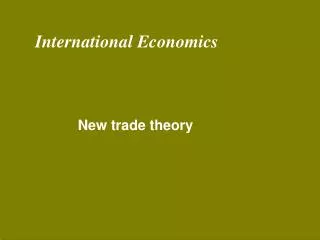
PX Sd P1X E Dw P2X P0X Quota Dd X2 X0 X 0 X3 What are the Effects of an Export Quota? a) Small-Country Case b) Large-Country Case PX P3X Sd k M j P1X g f h j g h L f Dd+w P2X P0X Quota Dd +Quota Dd X1 X2 X0 X 0 X1 X3
Export Quotas 1. Small Country • decreases domestic production, increases domestic consumption and reduces domestic prices 2. Large Country • decreases domestic production, increases domestic consumption,reduces domestic prices and increases world prices
Voluntary Export Restraint • Definition • Bilateral agreement between two countries wherein the exporting country limits its exports to the importing country. • Mainly done to forestall other trade restrictions • Economic Effects of VER • Same as import quota for importing country • VER administered by exporting countries : rents captured by foreign exporters. (eg: Textiles, Steel, Automobiles)
Export Subsidies • Payment made to a firm to export • Economic effects (inverse of a tariff) • raises prices in the exporting country • lower prices in importing country
What are the Effects of an Export Subsidy? Exporting-Country Perspective
What are the Effects of an Export Subsidy? Importing-Country Perspective
Export Subsidies Source: Data from U.S. Trade Representative, National Trade Estimate Report on Foreign Trade Barriers (Washington, D.C.)
Production Subsidies • Subsidies given to promote a specific industry • Indirect effect on trade • Rise in production leads to rise in exports • If a large exporter, pushes down the world price • Net loosers are the producers in importing country and third country exporters.
Dumping • Price-based Definition • When a good is sold in the foreign market at a price below that of the domestic market • Cost-based Definition • When a good is sold in the foreign market at a price below the cost of production
Types of Dumping • Sporadic Dumping • Persistent Dumping • Predatory Dumping
Other NTBs • Administrative and Technical standards • Domestic content requirements • Government Procurement Policies
New Developments in NTB Policies 1.Tariff Rate Quota 2. SPS and Technical standards 3. Trade Facilitation 4. Rules of Origin
Quantifying the Effects of NTMs Contd…. 1. Methodological Issues • Producer behaviour differs under Tariffs and NTMs. A competitive under Tariffs and as a monopolist under Quota. • A tariff and a NTM affecting the same product may or may not be additive. • Most NTMs are discriminatory, having differential effects. • The linkage between exchange rate and trade flows is strong. Exchange rate fluctuations can have potential effects on trade flows.
Quantifying the Effects of NTMs • Measurement • Inventory Approach (Coverage ratio) = Value of imports/exports subjected to NTB Total Imports/Exports • Modelling Approaches ( Price based econometric models, Quantity based econometric models, Simulation models) • Price wedge ( Tariff Equivalence) • Subsidy Equivalents (PSE)
Methods for Analysing NTBs 1. “Handicraft” Price Gap Method 2. Price based Econometric Methods 3. Quantity based Econometric Methods 4. Simulation methods
Price Gap Method • Compare the price before and after NTB to capture the mark-up or rent • Price difference to be corrected for non-NTB factors influencing prices • Factors that influence Price gap • Marginal cost vs. Ex-factory price • f.o.b and c.i.f • Price after customs clearing (includes tariff) • Wholesale price (includes VAT & excise) • Retail price 4. Challenge is to identify where NTB occurs and who benefits
Nominal Protection Rates and Sources of Policy Distortion in China’s Agriculture, 2001(Import Tariff Equivalent) Source: Huang, et al. (2005), Table 1, FED Working Paper Series No. FE20050018
Econometric Methods 1. Data Issues • Aggregation Problems • Trade price data (unit values) • Data reconciliation (differences in export & import values) 2. Price Based methods 3. Quantity Based methods • Gravity models (exporters’ GDP, Importers’ GDP and distance) • Trade Restrictiveness Index
Estimated Tariff Equivalents of NTBs and Tariffs Source: Aapted from Kee, Nicita, and Olarreaga (2004b; 2004c) NB: OTRI is the overall trade restrictiveness index, the equivalent uniform tariff which keeps imports at their observed levels. TRI is the trade restrictiveness index (Anerson and Neary (1994)
Estimated Effects of Improving National Trade Facilitation Indicators on Merchandise Trade (% increase) Source: World Development Report, World Bank, 2008
Estimated Effects of Improving National Trade Facilitation Indicators on Merchandise Trade ( % increase) Source: Adapted from Wilson, Mann, and Otsuki(2005)
Analysis of Trade Policy Measures • Revealed Comparative Advantage • (Developed by Bela Balassa for assessing a country’s comparative • advantage for a certain commodity) • Trade Intensity Index • Export Specialisation Index • Export Diversification Index • Global Market Shares Changes • Growth rate of Exports/Imports
Revealed Comparative Advantage Index RCAij = (Xij/Xit)/(Xwj/Xwt) Xij = values of country i’s exports of product j Xit = country’s total exports Xwj = world exports of product j Xwt = world total exports RCA value of less than one implies that the country has a revealed comparative disadvantage in the product. RCA value more than one implies that the country has a revealed comparative advantage in the product
Revealed Comparative Advantage Values (Some Examples) Source: Raju et. al, 2009
Export Specialization Index ES = (Xij/Xit)/(Mkj/Mkt) Xij = export values of country i in product j Mkj = import values of product j in market k The ES is similar to the RCA. If the value of the index is less than unity, it indicates a comparative disadvantage and a value above unity represents specialisation in this market.
Changes in Global Market Share of Major Exports CDj = (Sit – Sio)*Mgt Where Sio and Sit represent a country’s global market share for product I in base year 0 and end year t and Mgt is global imports of the traditional product in year t. The index indicates the dollar value of export gains or losses associated with a country’s market share changes. Summing over all traditional products will indicate whether the country’s competitive position improved or worsened and what was the magnitude of the associated change in the value of exports
Export Diversification (or Concentration) Index DXij = (sum hij – xi )/2 Where hij is the share of commodity i in the total exports of country j and hi is the share of the commodity in world exports. The related measure used by UNCTAD is the concentration index or Hirschman (H) index.
Trade Intensity Index Tij = (xij/Xit)/(Xwj/Xwt) xij = values of country i’s exports to country j Xit = country i’s total exports Xwj= world exports to country j Xw = total world exports An index of more (less) than one indicates a bilateral trade flow that is larger (smaller) than expected, given the partner country’s importance in world trade.
Trade Intensity Index (Some Examples) Source: IIFT Note: TII value in Major Indian Markets
Relative Growth Rates of Merchandise Exports and Imports Gi = (X12/X11) (1/n-1) *100 Where X11and X12 are the trade values of product i in the beginning period and the end period respectively, and n is the number of years