Download
1 / 17
170 likes | 235 Views
This survey explores concepts such as parameters, quantitative data, level of measurement, sampling methods, biases, and experimental designs in statistics. Learn key principles to enhance statistical understanding.

E N D
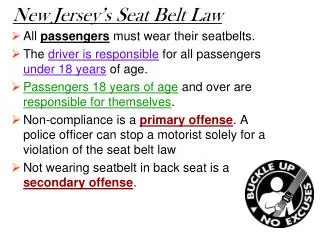
A survey of 200 adults in the U.S. found that 76% regularly wear seatbelts while driving. • True or false: 76% is a parameter. • True • False Section 1.1
A survey of 200 adults in the U.S. found that 76% regularly wear seatbelts while driving. • True or false: 76% is a parameter. • True • False Section 1.1
True or false: • The checking account numbers of customers at a bank represent quantitative data. • True • False Section 1.1
True or false: • The checking account numbers of customers at a bank represent quantitative data. • True • False Section 1.1
Determine whether the quantitative variable is continuous or discrete. • The time (in minutes) required for a student to complete a quiz. • Continuous • Discrete Section 1.1
Determine whether the quantitative variable is continuous or discrete. • The time (in minutes) required for a student to complete a quiz. • Continuous • Discrete Section 1.1
Identify the variable’s level of measurement: • Consumer Reports’ratings (Best Buy, Recommended, Not Recommended). • Nominal • Ordinal • Interval • Ratio Section 1.1
Identify the variable’s level of measurement: • Consumer Reports’ratings (Best Buy, Recommended, Not Recommended). • Nominal • Ordinal • Interval • Ratio Section 1.1
Determine whether the study depicts an observational study or an experiment: • Two sections of statistics are taught by the same teacher. One section uses MyStatLab; the other section does not. At the end of the semester grades in the two sections are compared. • Observational study • Experiment Section 1.2
Determine whether the study depicts an observational study or an experiment: • Two sections of statistics are taught by the same teacher. One section uses MyStatLab; the other section does not. At the end of the semester grades in the two sections are compared. • Observational study • Experiment Section 1.2
Identify the type of sampling used: • Students at a university are classified according to major. The administration randomly selects five majors. All students majoring in those five areas are surveyed. • Simple random sample • Stratified sample • Cluster sample • Systematic sample Section 1.4
Identify the type of sampling used: • Students at a university are classified according to major. The administration randomly selects five majors. All students majoring in those five areas are surveyed. • Simple random sample • Stratified sample • Cluster sample • Systematic sample Section 1.4
Determine the type of sampling bias: • A college wants to survey students about reducing the hours of the computer lab. To conduct the survey, they select the next 50 students to enter the computer lab. • Sampling bias • Response bias • Nonresponse bias Section 1.5
Determine the type of sampling bias: • A college wants to survey students about reducing the hours of the computer lab. To conduct the survey, they select the next 50 students to enter the computer lab. • Sampling bias • Response bias • Nonresponse bias Section 1.5
Determine the type of experimental design: • A company wants to study the relationship between product placement on a shelf and sales volume. Twenty stores of comparable size are selected and 5 stores are randomly assigned to each of the 4 shelf levels. After a month, the sales volumes of each group are compared. • Matched Pair • Completely Randomized Design • Randomized Block Design Section 1.6
Determine the type of experimental design: • A company wants to study the relationship between product placement on a shelf and sales volume. Twenty stores of comparable size are selected and 5 stores are randomly assigned to each of the 4 shelf levels. After a month, the sales volumes of each group are compared. • Matched Pair • Completely Randomized Design • Randomized Block Design Section 1.6