Download
1 / 25
250 likes | 267 Views
Explore the challenges and opportunities in the ethanol industry's integration with the motor fuel pool, including supply-demand dynamics and policy considerations for sustainable growth.

E N D
Ethanol In the Motor Fuel Pool :Supply, Demand and Policy Considerations Larry KuminsVice President, Research and Analysis Energy Policy Research Foundation Inc.At Center For Energy Studies Louisiana State University April 27, 2007
Introduction • Energy Policy Research Foundation Inc. (EPRINC): successor organization to the Petroleum Industry Research Foundation Inc. (PIRINC) • Founded in NY in 1944 • Re-imagined in DC in 2007 as EPRINC • EPRINC brings policy analysis and industry economics to bear on current energy issues
Agenda • Part I: Ethanol Comes of Age—MTBE Replacement • Part II: Corn—Supply & Price • Part III: Vehicle Fleet Constrains Ethanol Consumption • Part IV: Oil Refiners—Adversely Impacted? • Part V: Energy Security/ Oil Imports
Ethanol is NOT Oil • Volume vs. Energy Content: Btu content is only 2/3rds gasoline • Volumes do not hold comparable energy value; current $2.17/gal ethanol price is the energy equivalent of $3.24 gasoline • Physical issues: Mix tends to separate; attract water. Can’t be shipped by pipeline • Expensive transport: 75% by rail; 25% truck; oil moves by pipeline at 1/4th cost • Mixture has short shelf-life: blended locally • Gallons vs. Barrels: Ethanol industry measures in gallons per year; petroleum in barrels per day. Optics of large numbers.
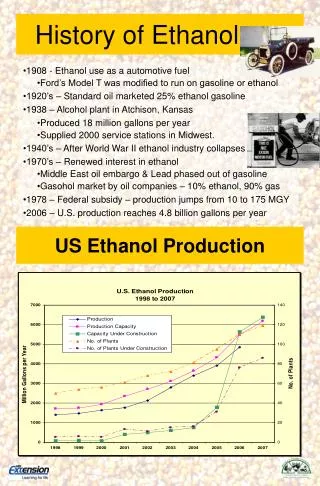
Some Background • Used as a high octane motor fuel since internal combustion invented • Energy Tax Act of ’78 started the federal tax exemption 4 cents/gal “gasohol” • American Jobs Creation Act of 2004—51 cents per gal for ethanol blended • EPAct 05 mandates—4.0 bil gals in 2006; 7.5 bil gal in 2012
Some Background(continued) • MTBE was a blending component of choice, adding oxygen content and boosting octane. Needed to make oxygenated gasoline. • MTBE Phase-out: • In process since 2000 • Consumption peaked at about 300,000 b/d • Zeroed-out in 2006 • Essential and complimentary to making gasoline • Max MTBE use: ~300,000 b/d • Now replaced with ~400,000 b/d ethanol
Price Update: Ethanol, Mogas, Corn Source: CBOT and NYMEX near-month futures contracts Note: Corn prices/2.8 = gallon equivalent price
Corn Ethanol Production 2007. . .expect to use 27% of ’07 corn crop for nearly 9 bil. gal. Source: Keith Collins, Chief Economist, USDA. Presentation at the EIA Outlook Conference 3/07
Corn Prices: 2005 - 2007 Apr 07 Source: USDA; CBCT
Farmers Respond to High Corn Prices - 2007 • Record Corn Plantings - Highest Since 1944 • Corn acreage increased 15% Using land from: • Cotton—acreage down 20% • Soybeans—acreage down 11% • Price Implications • Corn prices fell ~$0.50 per bu on report release. • Cotton and soybean prices will rise because of smaller plantings Source: USDA, Prospective Plantings. Mar.2007
High Agricultural Product Prices • Between 2006 and 2007 Corn prices rose by $1.50 to $2.00 • Record corn prices increased consumers food cost by an estimated $15 to $20 billion • Cotton and Soybean prices will rise as a result of acreage reallocation to corn • These higher prices will impact the rate of inflation, with adverse macroeconomic impact
Part III: Vehicle Fleet Constrains Ethanol Consumption
Vehicle Fleet Will Slow Ethanol Uptake • Auto fleet designed to use 10% ethanol; it can’t use more • Ethanol transport constraints prevent universal distribution • Not all gasoline blenders can get ethanol • Less than 100% mogas can be E-10 • If higher blends are to be consumed, more E-85 (FFVs) needed in fleet E-85 vehicles have sold poorly: • Out of 237 million vehicles on the road, only6 million are FFVs • Detroit makers pledged half 2012 output will be FFVs; foreign makers not showing interest • In 2017, 280 million vehicles on the road: How many will be FFVs? Implication: if Detroit succeeds, only 25% of new vehicles sold will be FFVs
Investment: Ethanol Plant vs. Oil Refining • Refining---2003-2006 • Refining capacity grew by 0.6 mbd • Imports of refined oil product grew by 1.0 mbd • U.S. refining capacity continues to lag consumption growth • Results in very high refinery utilization w/o capability to deal with outages, scheduled maintenance, etc. • Current gasoline price situation--$2.15 in January; $2.85 in April due to refinery outages • Ethanol Capacity Grew Rapidly • 115 plants operating; 375,000 b/d capacity • 86 plants under construction; 400,000 b/d capacity • Ethanol and oil compete for capital and for the same materials and services • Ethanol may be crowding out investment in petroleum refining
Gasoline Consumption 2017 (mbd): “20 in 10” Changed Perceptions for Refiners • 2017 Gaso Consumption- 1.3 mbd below expected- 0.7 mbd less than 2006 • DOE just reduced 2006 estimates of refinery growth—0.7 mbd less capacity in 5 years “20 in 10”
Ethanol Fuels Program Is Costly • $0.51 blender tax credit costs $3 bil per year at today’s rate of consumption. Costs rise as ethanol blending increases. • Because of lower energy value, a gallon of ethanol replaces 2/3rds of a gallon of imported gasoline. • At $2.19 per gallon of ethanol, this is the equivalent of ~$3.25 for each gallon of import saving. The tax credit adds to this. • Should the higher cost of corn to consumers be attributed to the reduction of oil imports? • Should costs arising from price increases in other crops resulting their displacement by corn acreage be attributed to oil import reduction?
Energy Security Goals: Minimizing Risk • Control Growth/Reduce Petroleum Imports • Buffer Economy from Price Shocks Caused By Adverse World Market Events • Encourage U.S. Refinery Capacity Catch-up With Consumption • Reduce risk from refinery mishaps BUT Depending on An Agricultural Commodity For Energy Supply Introduces New Risks Associated with Crop Cycle