Download
1 / 31
320 likes | 335 Views
Explore the impact of sleep, circadian rhythms, and fatigue on performance, uncovering how extended wakefulness, sleep loss, and workload affect simple and complex tasks. Learn about the 24-hour sleep/wake cycle, sleep deprivation effects on brain activity, and circadian rhythm influence on body temperature and alertness. Discover the recuperative value of sleep consolidation versus split or fragmented sleep patterns for enhanced performance. Dive into objective sleep and performance field measurements for practical application in operational settings.

E N D
Sleep, Circadian Rhythms, and PerformanceApplying Sleep Science to Operational Practice Gregory Belenky, M.D. Hans Van Dongen, Ph.D. Sleep and Performance Research CenterWashington State University Spokane
The Earth at Night:The Problem of 24/7 Operations From www.freemaninstitute.com/nightearth.htm Washington State University
Fatigue Degrades Performance • Fatigue degrades performance: • Simple performance, e.g., reaction time • Complex performance, e.g., accurate situational awareness • Perseverance slips into perseveration • Overall, slowing the Observe, Orient, Decide, Act (OODA) Loop • Fatigue is a combination of • time awake (sleep loss) • time of day (circadian rhythm) • time on task (workload) • Simple and complex performance are degraded by • extended time on task • sleep loss • adverse circadian phase • Performance is impaired by systematic degradation and increased instability
Components of Fatigue:Time Awake, Time of Day, Time on Task Adapted from Wesensten et al., 2004
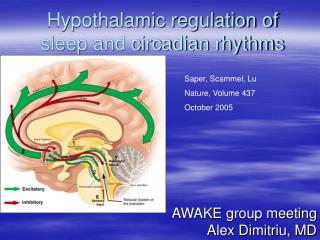
Physiology of Sleep Washington State University
0000 Non-Rapid Eye Movement Sleep (NREM) Waking 0600 1800 Rapid Eye Movement Sleep (REM) 1200 The 24-Hour Sleep/Wake Cycle • Two distinct states of sleep cycling with a 90-100 min periodicity • Recuperation is a function of total sleep time Washington State University
120 100 80 60 40 20 0 - Mean Performance (N=17) - Cubic Spline - Linear Regression Throughput (Percent of Baseline) PET Scans 0 24 48 72 86 Sleep Deprivation (Hours) Total Sleep Deprivation Imaging Studies From Thomas ML, Sing HC, Belenky G, et al. (2000). Neural basis of alertness and cognitive performance impairments during sleepiness. I. Effects of 24 h of sleep deprivation on waking human regional brain activity. Journal of Sleep Research 9: 335-352. And from Thomas ML, Sing HC, Belenky G, et al. (2003). Neural basis of alertness and cognitive performance impairments during sleepiness. II. Effects of 48 and 72 h of sleep deprivation on waking human regional brain activity. Thalamus & Related Systems 2: 199-229. Washington State University
N = 17 24 h SD 48 h SD 72 h SD Z > 4.16 + 32 mm AC-PC 3.08 2.58 + 8 mm AC-PC 2.33 1.65 Brain Metabolism at 24, 48, & 72 Hoursof Sleep Deprivation Relative to baseline, the prefrontal cortex and the thalamus are most affected by sleep loss From Thomas ML, Sing HC, Belenky G, et al. (2000). Neural basis of alertness and cognitive performance impairments during sleepiness. I. Effects of 24 h of sleep deprivation on waking human regional brain activity. Journal of Sleep Research 9: 335-352. And from Thomas ML, Sing HC, Belenky G, et al. (2003). Neural basis of alertness and cognitive performance impairments during sleepiness. II. Effects of 48 and 72 h of sleep deprivation on waking human regional brain activity. Thalamus & Related Systems 2: 199-229. Washington State University
Circadian Rhythm in Core Body Temperature, Sleep Propensity, and Performance Washington State University
Circadian Rhythm in Body Temperature and Performance Psychomotor vigilance 10% fastest RTs (ms) Core body temperature (ºC) From Van Dongen HPA, Dinges DF (2005). Circadian rhythms in sleepiness, alertness, and performance. In Kryger MH, Roth T, Dement WC (Eds.), Principles and Practice of Sleep Medicine (4th ed.). Elsevier Saunders, Philadelphia, Pennsylvania: 435-443.
Sleep Deprivation vs. Alcohol Intoxication Dawson & Reid, 1997 Washington State University
Chronic Partial Sleep Restriction:Effects on PerformanceA Sleep Dose Response Study Washington State University
Psychomotor Vigilance Task Performance across Sleep Restriction and Recovery From Belenky G, Wesensten NJ, Thorne DR, Thomas ML, Sing HC, Redmond DP, Russo MB, Balkin TJ (2003). Patterns of performance degradation and restoration during sleep restriction and subsequent recovery: a sleep dose-response study. Journal of Sleep Research 12: 1-12. Washington State University
Recuperative Value of Sleep Washington State University
Consolidated vs. Split vs. Fragmented Sleep • Recuperative value of sleep depends on total sleep time over 24 hours • Consolidated sleep • Nocturnal (night) – typically 7-8 hours; facilitated by circadian rhythm • Diurnal (day) – typically ~ 5 hours; truncated by circadian rhythm • Split sleep • 5 nocturnal / 2-3 diurnal • Fragmented sleep • Awakening every 2-3 minutes • Fragmentation to this degree abolishes recuperative value of sleep • Sleep interrupted every 20 mins as recuperative as uninterrupted sleep Bonnet M & Arand D (2003) Clinical effects of sleep fragmentation vs. sleep deprivation. Sleep Medicine Reviews, 7(4) 297-310 Washington State University
Objective Measurement of Sleep and Performance in the Field Environment&Integration with Modeling Washington State University
Objective Field Measurement of Sleep and Performance • Palm OS Psychomotor Vigilance Test (PVT) • 10 minute test • Work/Sleep Log • Sleep periods • Start/Stop times of shift • Actigraph watches • Wear 24hrs/day • Monitors sleep • More reliable than self-reported sleep • Equivalent to polysomnography in measuring total sleep time / 24 hours
Effect of Sleep Loss on Performance on the Psychomotor Vigilance Test (PVT) 12 Hours Awake 36 Hours Awake 60 Hours Awake 84 Hours Awake Washington State University
Actigraph Data Scored to Generate Sleep/Wake History Nighttime Awakening Daytime Nap Washington State University
Actigraph Sleep/Wake History Input to Mathematical Performance Prediction Model Daytime Nap Nighttime Awakening Washington State University
Fatigue Risk Management System (FRMS) • Five-tiered defense-in-depth to prevent fatigue-related errors, incidents, and accidents • Tier 1 – Does system of shift timing and duration allow for adequate opportunity for sleep? • Computer-based rostering • Predictive modeling • Tier 2 – Do employees take advantage of the sleep opportunity? • Self-report • Wrist-worn actigraph (sleep watch) • Tier 3 – In the workplace, do they maintain adequate alertness and performance? • Self-report & co-worker report • Palm Pilot-based Psychomotor Vigilance Task (PVT) • Embedded performance metrics • Tier 4 – Are there errors, near misses? • Tier 5 – Are there incidents and accidents? From Dawson D, McCulloch K (2005). Managing fatigue: It’s about sleep. Sleep Medicine Reviews 9: 365-380.
Reprise of Sleep Physiology and Performance • Fatigue is a function of sleep/wake history, circadian rhythm, and workload • Sleep loss degrades performance • Sleep restores it • All performance degrades with sleep loss • Slower to observe, orient, decide, and act (OODA) • Adequate total sleep time sustains performance • Naps add to total sleep time • Divided sleep is as good as consolidated sleep • Performance and sleep propensity follow the 24-hour circadian rhythm in body temperature Washington State University
The Sleep and Performance Research Center Gang Washington State University
Point of Contact Gregory Belenky, MD Research Professor and Director Sleep and Performance Research Center Washington State University P.O. Box 1495 Spokane, WA 99210-1495 Phone: (509) 358-7738 FAX: (509) 358-7810 Email: belenky@wsu.edu Washington State University
The End Washington State University
Consequences of Sleep Loss • Short term • Minutes, hours • Error, accident, catastrophe • Mid-term • Weeks, months, years • Bad planning, inadequate strategizing, poor life decisions • Long-term • Years • Possibly promote cardiovascular disease, hypertension, overweight/obesity, type II diabetes, sleep disordered breathing • Triad of factors supporting health, productivity, and well-being • Diet • Exercise • Sleep Washington State University
Brain Metabolism during Non-REM and REM Sleep Frontal areas are deactivated during Slow Wave Sleep; decline in blood flow of ~30% (similar to sleep deprivation) Frontal areas remain deactivated during REM; increase in flow to waking levels or above except in prefrontal cortex Frontal areas are slowly reactivated after awakening (sleep inertia) From Braun AR, Balkin TJ, Wesensten NJ, Carson RE, Varga M, Baldwin P, Selbie S, Belenky G, Herscovitch P (1997). Regional cerebral blood flow throughout the sleep-wake cycle. An H215O PET study. Brain 120: 1173-1197.
CDL Volunteers in the Laboratory • Sleep measured with poly-somnography (electrodes, wires, recorders) • Performance measured with computer-based tests. Washington State University
8 hrs in bed 8 hrs in bed 3, 5, 7, 9 hrs in bed 4 5 6 7 8 9 10 11 12 13 14 15 1 2 3 Adaptation Phase Recovery Phase Experimental Phase Release from study Design of the Study Washington State University
Mean Sleep, Baseline, Experimental Days, & Recovery Mean Sleep Experimental Days 9 hr group – 7.9 hrs 7 hr group – 6.3 hrs 5 hr group – 4.7 hrs 3 hr group – 2.9 hrs Washington State University
Performance Prediction Modeling Integrated into Rostering and Scheduling Software • Personal biomedical status monitoring • Sleep/wake history (by sleep watch) • Circadian rhythm phase (by technology TBD) • Predict performance in real time person by person (by biomathematical performance prediction model) • Validate with embedded performance metrics, e.g., • Lane deviation (trucking) • Flight performance (commercial aviation) • Integrate performance prediction into rostering and scheduling software • Integrate into the objective function • Optimize along with other constraints • Potential for automated/turnkey solution for fatigue risk management Washington State University