More Continuous Distributions
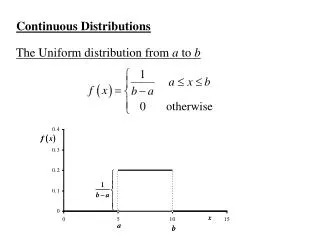
More Continuous Distributions. Beta Distribution. When modeling probabilities for some proportion Y, 0 < Y < 1, consider the Beta distribution: for parameters a , b > 0, where. A Useful Identity.

More Continuous Distributions
E N D
Presentation Transcript
Beta Distribution • When modeling probabilities for some proportion Y, 0 < Y < 1, consider the Beta distribution:for parameters a, b > 0, where
A Useful Identity • Since this is a density function, we knowor equivalently, which is easy to compute when a and b are integers.
Mean, Variance for Beta • If Y is a Beta random variable with parameters a and b, the expected value and variance for Y are given by
Cumulative? • For the special case when a and b are integers, it can be shown that the cumulative probabilities can be determined using binomial coefficients.
Beta and the Binomial • Show that the following density function is for a Beta distribution. Determine a and b. • Show that …using integration or using the binomial probabilities.
The Lognormal Distribution • Unlike the normal curve, it’s not symmetric. • May be appropriate for modeling “insurance claim severity or investment returns”. • If Y is lognormal, thenln(Y) has the normal distribution.
Lognormal Mean, Variance • If ln(Y) is a normal random variable with mean m and variance s 2, then Y is lognormal with mean and variance given by:
Lognormal Probabilities • Suppose Y is lognormal and ln(Y) = X where X ~ N(m,s). Then the cumulative probabilitymay be computed using the z-score and the table of standard normal probabilities. If claim amounts are modeled using a lognormal random variable Y = eX, where X ~ N(7, 0.5). Find the probability P( Y< 1400 ).
Pareto Distribution • For modeling insurance losses, consider the Pareto distribution with density functionand distribution function Suppose there is a deductible on the policy, so values of y less than b are not filed.
Pareto Distribution • If Y is a Pareto random variable with parameters a and b, the mean and variance given by:
Weibull Distribution • When there was a constant failure rate l, we often model the time between failures using an exponential distribution with mean 1/ l. • If the failure rate increases with time or age, consider using a Weibull distribution
Weibull Mean, Variance • If Y is a Weibull random variable with parameters a , b > 0, the mean and variance are given by:
Weibull Distribution • Note that for a = 1, the Weibull distribution agrees with the exponential distribution. But when a > 1, the Weibull distribution yields a higher failure rate for larger x(i.e., failure rate increases with age).
Failure Rate • A “failure rate” function is defined by For a time interval t < T < t + h , we consider this as …the probability of failing in the next htime units, given the part (or person) has survived to time t. Thus, l(t) is thought of as failures per unit time.
Comparing Failure Rate • For the exponential distribution f (y) = le-ly, we note Comparing this to the Weibull distribution, …so here the failure rate is increasing with x, if a > 1.
Moment Generating • As with discrete distributions, we can define moment generating functions for continuous random variables, such that the moments of Y are given by
Some common MGFs • The MGFs for some of the continuous distributions we’ve seen include: • Note that not all distributions have a MGF that can be written in a nice and tidy, closed-form expression.