Continuous Distributions
Continuous Distributions. The distributions that we have looked at so far have involved DISCRETE Data The outcome was a natural number or a count Many Data Sources however do not always have a discrete outcome.


Continuous Distributions
E N D
Presentation Transcript
The distributions that we have looked at so far have involved DISCRETE Data • The outcome was a natural number or a count Many Data Sources however do not always have a discrete outcome
You may have data that is fractional or has decimal values which is classified under CONTINUOUS DATA. Continuous data also has Probability Distributions
Ex PG 414 Investigation • Create a Scatter plot • Sketch a smooth curve • Describe the probability Distribution
These Probability Distribution graphs are smooth curves Positively Skewed Negatively Skewed
Positively Skewed • Tail pulled to the right…the Mean is to the right of the hump • Mode at hump • # children in families • Growth rate of plants
Negatively Skewed • Tail to the left…mean is to the left of the hump • Mode at hump
Bimodal • A distribution with 2 groups with different attributes • Mean in the middle of humps • 2 modes • Adult Shoe size or height
The curves represent the probability density, which is the probability per unit of a continuous variable To find the probability that a variable falls in a particular range of values we determine the area under the distribution curve This can be quite difficult, so we have given curves an equation that models it to allow us to calculate the area
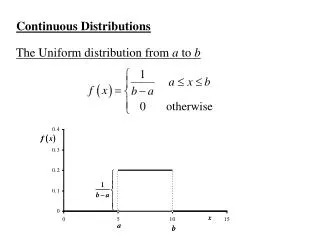
Uniform Distribution Ex The time it takes to drive from Toronto to North Bay is found to range evenly between 195-240 minutes. What is the probability that the drive will take 210 min?
Since we are told in the question that the time ranges evenly…THIS is a Uniform Distribution and that every range is equally likely giving us a straight line for a graph The area under the curve must be 1 Since Uniform the area can be found using Area of a rectangle
0.022 195 210 240
A continuous distribution that is distributed symmetrical and unimodal about the mean. The mean and standard deviation intervals are labelled on the curve Now we are going to discuss and develop different models for distributions that will show ALL possible outcomes Normal Distribution (Bell Curve) -3- 2- + + 2 + 3
Normal Distributions can be completely described their mean, , and standard deviation, . Mode and median can also be used in place of mean if they are a better representation of the middle value of the data.
close together or clustered If the standard deviation of the data is small, the data is _________________________ and the bell shape is ___________________. If the standard deviation of the data is larger, the data is _________________________ and the bell shape is ______________________. Narrow Far apart or larger dispersion Wide
A normal Distribution Curve has highly predictable properties. The areas under the normal distribution curve are always the same for each interval of standard deviation. It does not matter how the curve is stretched.
Example The weights of 10000 women athletes are normally distributed with a mean of 55 kg and a standard deviation of 5 kg.
a) Draw and label the normal distribution curve that represents the data. 40 45 50 55 60 65 70
b) Find the number of women weighing between 50 and 60 kg. 40 45 50 55 60 65 70 68.2%
c) Find the number of women weighing less than 45kg. 40 45 50 55 60 65 70 2.15%
d) Find the range of weight for 99.7% of the population. Range from 40-70kg 40 45 50 55 60 65 70 99.7%
e) Find the number of athletes that weigh more than 68 Kg. • 68kg will be ½ the distance from 65 to 70 which is 2.15% of the values • Therefore 2.15/2=1.25% will be more than 68kg • 10 000 x .0125=125 people
Example:Giselle is 168 cm tall. In her high school, boys’ heights are normally distributed with a mean of 174cm and a standard deviation of 6cm. What is the probability that the first boy Giselle meets at school will be taller than she is?
You need to find the Probability that the boys height will be greater than Giselle's (168cm) • P(168<boys height) 168 174 Boy’s Height (cm)
168 174 Boy’s Height (cm)
Equations and Probabilities for Normal Distribution • The curve of a normal distribution with mean and standard deviation is given by
Very Scary!!!! • That equation corresponds to the area under the normal distribution curve. • We use z-scores instead of a normal grid with squares • Recall z-scores is the number of standard deviations a value lies above or below the mean • Recall that z-scores or
Standard Normal Distribution • Is a special type of normal distribution where • The areas under this type of normal curve are known to a very high degree of accuracy and are printed in the back of your text book in a table • Pg 606-607
Ex: The mass of a packaged product is normally distributed with a mean of 50.5g and a standard deviation of 0.6g. The company wants to ensure that each package has at least 49.5 g of product in it. What percent of packages do not contain this much product?
Let X be the mass of product in package • P(X<49.5) is what we are trying to find 49.5 50.5
Use the table in the back of text book Find the probability that a standard normal variable is less than this z-score
The mass of 49.5 lies 1.67 standard deviations below the mean
Homework! Pg 430 #1-4,7,8,9, do your homework...