Download
1 / 18
180 likes | 347 Views
Systematics and Phylogenetics Ch. 23.1, 23.2, 23.4, 23.5, and 23.7. Diversity Matters. Not all species, even closely related ones, interact with their environments the same way Mosquitos and Plasmodia Plasmodia causes malaria

E N D
Systematics and PhylogeneticsCh. 23.1, 23.2, 23.4, 23.5, and 23.7
Diversity Matters • Not all species, even closely related ones, interact with their environments the same way • Mosquitos and Plasmodia • Plasmodia causes malaria • Only 3:6 mosquito species can carry the disease and spread it • Understanding and categorizing species is important in all areas of biology • Systematics study of life’s diversity and all evolutionary relationships
Linnaeus System • Binominal nomenclature (two name system); uses genus and specific epithet (species name) to categorize similar species • Taxonomy groups species through different taxa (levels of similarity) • Domain most general; Bacteria, Archaea, Eukarya • Species most specific; Homo sapien • Names come from location of habitat, physical trait, scientist who discovered it, etc…
Taxonomic Hierarchy • Classification limited to more inclusive groups (taxa) as you specify the organism • Domain • Kingdom • Phylum • Class • Order • Family • Genus • Species • Subspecies
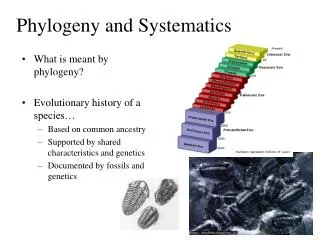
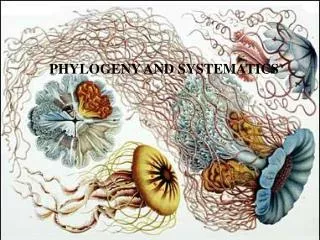
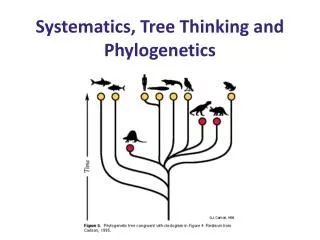
Phylogenetics • Just categorization is no longer important; now we are looking for the evolutionary connection between organisms • Phylogeny evolutionary history of a species • Phylogenetic tree visual representation of their phylogeny • Species at the base are common ancestors • Species in the branches are close variants
Anagenesis • Trees can be large; cover all known organisms • Trees can be small; cover only a specific genus • Trees can show specific changes through format • Straight lines show anagensis; gradual changes as a new species changes from the original population; no increase in biodiversity
Cladogenesis • Branching points depict two species diverging from a common ancestor; increase in biodiversity • Branches meet at their common ancestor • Branches can split again into “branchlets” which can form “twigs” • Every node (branching point) is the “root” for the generations that spring from it (clade) • Aves clade for birds • Birds of Prey nested clade inside Aves • Sister clads clades that share same node • Sister spices species that share the same node
Types of Phylogenetic Trees • Monophyletic • All species connected to one ancestral clade • Felidea clade all species of cat (tigers, house cat, lion, etc…) lead back to • Animalia clade all animals lead back too • Polyphyletic • Organisms of different clades but not their common ancestor • Vertebrates capable of flight (Birds and Bats); common ancestor (extremely ancient) not included
Types of Phylogenetic Trees 3) Paraphyletic • Clade of an ancestor but not all its descendants • Clade of birds and terrestrial dinosaurs; linkage to birds shown but not all descendants made by terrestrial dinosaurs • Depending on what information needs to be explained, this different types are necessary
Cladistics • Traditional systematics organizing trees based on morphology and evolutionary relationship • Popular up till the 1960s • Cladistics phylogenetic trees should reflect just evolution patterns of physical traits (characters; character states) • Ancestral character states original traits of the common ancestors • Derived character states new traits branching from the ancestral ones
Making a Cladogram • Cladistic method groups species into clade by shared derived characteristics; generate a cladogram • Hypothesized evolutionary connection • Node common ancestor • Branch monophyletic group; sometimes contain specific synapomorphies in clade • Molecular sequencing (protein, DNA, RNA) also used with synapomorphies comparisons • Help deal with convergent evolution, which presents false synapomorphies
Comparing Character States • Character states can be compared to each other in any number of ways • Often compared with other species that don't possess the character • Apomorphy derived character • Synapomorphy derived character found in multiple species • Shared characteristics shows species are part of the same clade • Markers for monophyletic lineages; adaptive radiation after major adaptation
Principle of Parsimony • Large cladograms, with 100s of species, have too many factors for humans to consider • Computer programs must be used to find the “best” cladogram • Principle of Parsimony simplest evolutionary history is the most likely; rare for many complex evolution events to have occurred • Molecular statistics have a major effect • Non-coding DNA, degenerate DNA codons, substitution rates of nucleotides all influence the statistical amount of mutation a population can experience
Statistics is the Key • Taking both fossil and evolutionary statistical data, two methods can be used to find the best cladogram • Maximum Likelihood Method • Data compared with other established cladogramsto find the “most likely” clade • Bayesian Method • Compares the distribution of character traits to the evolutionary model that would be needed for them to occur
Using Synapomorphies • Comparison of the species that do and do not have an apomorphy can organize the clade • Vertebral column in animals: • Most species of animals are invertebrates (no backbone) • Vertebrates (fish, mammals, birds, etc…) do have a backbone • Comparing the synapomorphies: • No backbone Ancestral • Backbone Derived
Using Synapomorphies to Support Data • If there is not enough data from fossils, apomorphies can still be compared with outgroup comparisons • Ingroup species in question with derived trait • Outgroup closely related species (not in clade) with ancestral trait • Butterfly legs groups of 6 and 4 • Outgroup comparisons show most insects have 6 legs • 6 legs ancestral • 4 legs derived
Using Molecular Data • Clades can have conflicting models that both have large support • Molecular comparing is sometimes the only method of categorizing group properly • Domains: Archaea, Bacteria, and Eukarya • All similar to each other in various ways • Evolution places Eukarya branching from Bacteria and Archaea branching from Eukarya • However, after their branching point, the transfer of some genetic material may have occurred (Horizontal gene transfer) through transformation, transduction, and even viral infections
Homework • Suggested Homework: • Test Your Knowledge • Actual Homework: • Discuss the Concepts #3 • Design the Experiment • Interpret the Data • Test Next Wednesday on Ch. 22, 23, and 24! • Final covers All chapters since mid-term (not 18 and 19)