Download
1 / 33
330 likes | 522 Views
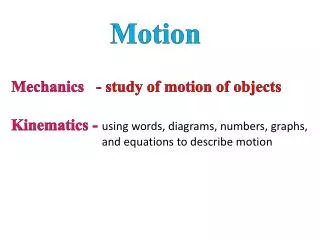
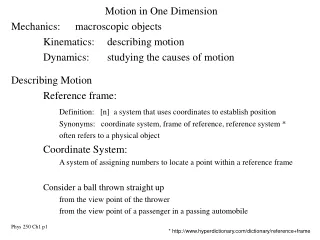
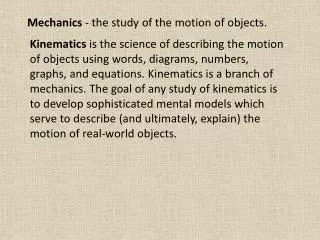
Mechanics - the study of the motion of objects.

E N D
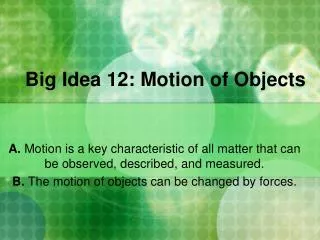
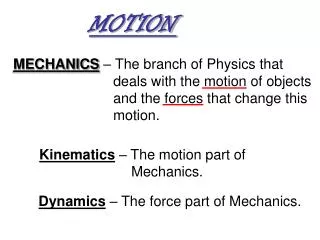
Mechanics - the study of the motion of objects. Kinematics is the science of describing the motion of objects using words, diagrams, numbers, graphs, and equations. Kinematics is a branch of mechanics. The goal of any study of kinematics is to develop sophisticated mental models which serve to describe (and ultimately, explain) the motion of real-world objects.
Scalars are quantities which are fully described by a magnitude (or numerical value) alone. Vectors are quantities which are fully described by both a magnitude and a direction. Scalar Vector Vector Scalar Scalar Scalar
Distance is a scalar quantity which refers to "how much ground an object has covered" during its motion. Displacement is a vector quantity which refers to "how far out of place an object is"; it is the object's overall change in position. Consider the motion depicted in the diagram below. A physics teacher walks 4 meters East, 2 meters South, 4 meters West, and finally 2 meters North.
Q) What is the displacement of the cross-country team if they begin at the school, run 10 miles and finish back at the school? The displacement of the runners is 0 miles. While they have covered a distance of 10 miles, they are not "out of place" or displaced. They finish where they started. Round-trip motions always have a displacement of 0. Q) What is the distance and the displacement of the race car drivers in the Indy 500? The displacement of the cars is somewhere near 0 miles since they virtually finish where they started. Yet the successful cars have covered a distance of 500 miles.
Speed is a scalar quantity which refers to "how fast an object is moving." Speed can be thought of as the rate at which an object covers distance. A fast-moving object has a high speed and covers a relatively large distance in a short amount of time. Velocity is a vector quantity which refers to "the rate at which an object changes its position.
Instantaneous Speed - the speed at any given instant in time. - the speed at any given instant in time. Average Speed - the average of all instantaneous speeds; found simply by a distance/time ratio. Instantaneous Speed is the velocity at different points.
Acceleration is a vector quantity which is defined as the rate at which an object changes its velocity. An object is accelerating if it is changing its velocity. Which car or cars (red, green, and/or blue) are undergoing an acceleration? Study each car individually in order to determine the answer The red car is moving with constant velocity so it does not accelerate The green car was slow in the beginning but accelerate at the end. The blue car is accelerating right from the beginning. The blue and green cars covers increasing in each second. Which car (red, green, or blue) experiences the greatest acceleration? The blue car
Consider the position-time graph at the right. Each one of the three lines on the position-time graph corresponds to the motion of one of the three cars. Match the appropriate line to the particular color of car. Red car is moving with constant velocity so will match to B Blue and Green have changing velocity therefore will match with Aand C Blue car matches with A which greater slope and green matches to C with less slope because Blue car’s velocity changes drastically.
whether the object is speeding up or slowing down whether the object is moving in the + or - direction If the object is speeding up then it has positive acceleration If the object is slowing up then it has negative acceleration which is also called deceleration.
For A Use a = (vf- vi) / t and pick any two points. a = (8 m/s - 0 m/s) / (4 s) a = (8 m/s) / (4 s) a = 2 m/s2 For B Use a = (vf-vi) / t and pick any two points. a = (0 m/s - 8 m/s) / (4 s) a = (-8 m/s) / (4 s) a = -2 m/s2
The Meaning of Shape for a p-t Graph To begin, consider a car moving with a constant, rightward (+) velocity - say of +10 m/s.
Now consider a car moving with a rightward (+), changing velocity - that is, a car that is moving rightward but speeding up or accelerating.
The position vs. time graphs for the two types of motion - constant velocity and changing velocity (acceleration) - are depicted as follows. Positive VelocityChanging Velocity (acceleration) Constant VelocityPositive Velocity
Fast, Leftward(-)Constant Velocity Slow, Rightward(+)Constant Velocity Negative (-) VelocitySlow to Fast Leftward (-) VelocityFast to Slow
Although the blue cars starts ahead, the red car is faster. The slopes will be different as in the graph.
The Meaning of Slope for a p-t Graph the slope of a position vs. time graph reveals pertinent information about an object's velocity. For example, a small slope means a small velocity; a negative slope means a negative velocity; a constant slope (straight line) means a constant velocity; a changing slope (curved line) means a changing velocity. Thus the shape of the line on the graph (straight, curving, steeply sloped, mildly sloped, etc.) is descriptive of the object's motion. Determining the Slope on a p-t Graph • etermine the difference in y-coordinates of these two points (rise). • Determine the difference in x-coordinates for these two points (run). • Divide the difference in y-coordinates by the difference in x-coordinates (rise/run or slope).
Consider a car moving with a constant, rightward (+) velocity - say of +10 m/s. As learned in an earlier lesson, a car moving with a constant velocity is a car with zero acceleration. If the velocity-time data for such a car were graphed, then the resulting graph would look like the graph at the right. Note that a motion described as a constant, positive velocity results in a line of zero slope (a horizontal line has zero slope) when plotted as a velocity-time graph.
Now consider a car moving with a rightward (+), changing velocity - that is, a car that is moving rightward but speeding up or accelerating. Since the car is moving in the positive direction and speeding up, the car is said to have a positive acceleration. If the velocity-time data for such a car were graphed, then the resulting graph would look like the graph at the right. Note that a motion described as a changing, positive velocity results in a sloped line when plotted as a velocity-time graph. The slope of the line is positive, corresponding to the positive acceleration. Furthermore, only positive velocity values are plotted, corresponding to a motion with positive velocity
The velocity vs. time graphs for the two types of motion - constant velocity and changing velocity (acceleration) - can be summarized as follows. Positive VelocityZero Acceleration Positive VelocityPositive Acceleration
Observe the motion of the two-stage rocket and the corresponding velocity-time graph above. The rocket has two consecutive fuel stages followed by a free-fall motion (no fuel). In the two fuel stages, the rocket experiences an upward acceleration of +10 m/s2 and +4.29 m/s2respectively. This acceleration is depicted by the slope on the velocity-time graph. After ten seconds, the second fuel stage ends and the rocket is acted upon only by the force of gravity. It subsequently experiences a downward acceleration of -10 m/s2. Note however, that from 10 to 16 seconds, the rocket continues moving upward (the velocity values are positive). During these six seconds, the rocket is moving upward but slowing down (the acceleration is downwards or negative as denoted by the negatively sloped line). It is not until after t =16 seconds that the rocket begins to move downwards.