Download
1 / 44
440 likes | 551 Views
Explore factors driving O3 distribution in the Tropics through observational data and models, emphasizing the role of dynamics and chemistry in O3 variability. Identify sources, transport mechanisms, and regional influences shaping O3 patterns.

E N D
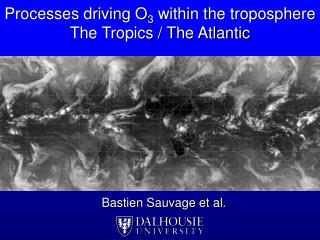
Processes driving O3 within the troposphereThe Tropics / The Atlantic Bastien Sauvage et al.
Ozone within the Tropics O3 maximum “zonal wave-one” 40W-60E MOZAIC+SHADOZ (1994-2004) zonal cross section O3 (ppbv) TOMS tropospheric O3 columns (1997) SON Pressure (hPa) W E longitude Sauvage et al., JGR 2006 Martin et al., JGR 2002 • Observed since the 80’s Logan and Kirchhoff, 1986;Fishman et al. 1987 • In the middle upper troposphere maximum radiative effect(de Forster, 1997) Key role on the oxidizing power of the atmosphere(Jacob et al, JGR 1996) Attributed to various anthropogenic and natural sourcesfrom Fishman et al. 1987… Thompson et al. 2000;2003… to Wang et al 2006 Goal: Quantify what controls tropical O3 / in the Atlantic?
(1) Overview •Tools • Tropospheric ozone chemistry • The Tropics: chemical and dynamical context (2) Methodology (3) Model evaluation: -Chemistry : Constraint on lightning and fire emissions -Dynamic (4) What controls the zonal wave one? (5) Conclusions
Coupled approach observations/model Satellite instruments In Situ Models MOZAIC programme (Marenco et al., 1998 … Volz-Thomas 2005): 1994-present GOME SCIAMACHY OMI Spectrometers backscattered solar radiations O3/ NO2/ HCHO OTD/LIS Lightning flashes LAGRANTO FLEXPART Méso-NH GEOS-Chem Automatic measurements O3, H2O + CO , NOyHigh temporal and spatial resolution and distribution overall O3 precision ± [2 ppbv]. ACE Fourier Transform Spectrometer/ Solar occultation +26000 Flights
Issues: the Tropics (chemistry) STE hv hv,H2O Nitrogen oxides (NOx) CO, Hydrocarbons Ozone (O3) Hydroxyl (OH) Fires Biosphere Anthropogenic activity O3 production primarily NOx limited Tropics: -Higher tropospheric reservoir -Photochemical activity exacerbated (High UV and relative humidity) -Numerous O3 precursor sources Spatialdistribution ~known Uncertainty on emission’s magnitude
Issues the Tropics (sources) 1/ Biogenic emissions Soils Natural source : NOx (pulses) through bacterial nitrification Monsoon season: Africa; North India; May-June ~ 70% soil NOx emitted within the Tropics Global production : 4-21 Tg N/yr …uncertain!
Issues: the Tropics (sources) 2/ lightning emissions (Li-NOx) Lightning density (1995-2004) OTD & LIS DJF Emissions: NOx (NO>75%) JJA Flash number km-2 min-1 Lightning activity mainly located within the Tropics (~65% of Li-NOx)! Global production : 1-13 Tg N/yr …uncertain!
Issues: the Tropics (sources) 3/ biomass burning emissions #fires 2005 (MODIS) 0 50 100 150 Source of NOx, VOCs … NOx: ~70% within the Tropics Global production : 3-13 Tg N/yr …uncertain!
Issues: the Tropics (sources) 3/ biomass burning emissions: seasonal variations Active fires AVHRR
Issues: Dynamical context Streamlines 850hPa (ECMWF) EQUATORIAL Africa and the Atlantic Saharan High Harmattan Harmattan East African Low level jet Monsoon Trades Trades St.Elena H St.Elena H JULY JANUARY Fires Inter tropical front (ITF)
Issues: Dynamical context Meridional cross section Tropical Easterly Jet 100hPa ITCZ NHadley S Hadley 600hPa African EJ NE HARMATTAN SW monsoon Sahara ITF 30°N 10°N 20°N EQUATOR 5°S Schematic circulation over West Africa monsoon season (JJA)
Issues: Role of dynamic u<0, v=0/AEJ u,v <0/Harmattan LAGOS LAGOS •fire pixels (ATSR) •fire pixels (ATSR) Pressure (hPa) Pressure (hPa) 600 650 700 750 800 850 900 950 600 650 700 750 800 850 900 950 LAGOS(Gulf of Guinea ) / DJF MOZAIC data (1994-2005) Pressure (hPa) Sauvage et al., ACP, 2005
Issues: Role of the dynamic Equivalent potential temperature (K) Meridional baroclinic cells (surface gradients role) Altitude (km) Meridional circulation T- /H+ T+ /H- e Méso-NH simulation Sauvage et al., ACP, to be submitted latitude • Lower tropospheric transport (trades, jets) affects O3 distribution (link between emissions and in situ measurements) Transport and creation of high O3 and COconcentrationsfrom fires ( >70 ppbv & 500 ppbv in monthly mean!)
Issues: Role of the dynamic O3 meridional gradients MOZAIC transects 300-180hPa • Convection ITCZ Affects O3 distribution Hadley cells Latitude Europe South Africa Sauvage et al GRL, in press Hadley cells role redistribution fires + Li-NOx emissions • Convection role in the Tropics 1/ Efficient and rapid vertical redistribution of precursors and species in the UT (longer lifetime) 2/ Global redistribution 3/ HOx impact UT reactivity
Issues: summary 1/ Important O3 precursor emissions in the Tropics But uncertain (intensity / processes) 2/ Importance of dynamics in the Tropics Lower troposphere (LT) and upper troposphere (UT) transport 3/ Importance of tropospheric ozone in the Tropics High O3 and precursors concentrations in the LT and UT Necessity to evaluate emissions and dynamic to better understand what controls O3 distributions
(1) Overview • Tropospheric ozone chemistry • Tropics: chemical and dynamical context (2) Methodology (3) Model evaluation: -Chemistry : Constraint on lightning and fire emissions -Dynamic (4) What controls the zonal wave one? (5) Conclusions
Methodology CTM (GEOS-Chem) Original version Understand O3 In the Tropics 1 2 Constraint and modifications(in situ and satellites) • Soils: NOxa posteriori inventory GOME(Jaeglé et al., Farad., 2005) Lightning: local redistribution OTD-LIS Fires: top-down inventoryNOx & VOCs / GOME Quantification (sources / regions) O3 maximum 3 4 Evaluation O3/RH/CO Constrained Model
(1) Overview • Tropospheric ozone chemistry • Tropics: chemical and dynamical context (2) Methodology (3) Model evaluation: -Chemistry : Constraint on lightning and fire emissions -Dynamic (4) What controls the zonal wave one? (5) Conclusions
Space-based constraint on Li-NOx spatial distribution GEOS-Chem simulations exhibited different spatial distribution of lightning compared to satellite Calculation of rescaling factor (R) OTD-LIS climatologies (1995-2004) spatial lightning redistribution (local approach) for simulated convective events -Factors are applied each month for the given season to retain monthly variation -If there is no deep convection in GEOS-Chem, no flashes, R =1 -No large episodic injection were apparent as convection as low temporal variability
Space-based constraint on Li-NOx spatial distribution LiNOx simulated Modified version OTD/LIS original version DJF DJF JJA JJA NOx emissions (109 molec N/cm2/s) -Important regional differences (seasonal latitudinal variation allowed) / Higher oceanic emissions -Same intensity: 6 Tg N yr-1
In situ data used to evaluate simulation (O3/CO/RH) 1.MOZAIC programme 1994-2005 2.SHADOZ ozone sonde network (Thompson et al., 2003a;b): 1998-2004 MOZAIC & SHADOZ sites used for model evaluation > 9000 O3 / RH vertical profiles within the Tropics (30°N-30°S)
O3 sensitivity to Lightning NOx spatial distribution Snapshot of the model evaluation Original Modified In situ Pressure (hPa) Pressure (hPa) O3 (ppbv) O3 (ppbv) -O3 highly sensitive in the MT-UT -O3 simulations improved by 5-15 ppbv/ In situ -Main influence near subsidence areas: South America; Middle East; Atlantic
O3 sensitivity to LiNOx intensity 4 TgN/yr; 6 TgN/yr; 8 TgN/yr Pressure (hPa) Pressure (hPa) O3 (ppbv) Evaluation for the Tropics 8Tg N/yr O3 over estimation 4Tg N/yr O3under estimation 6±2Tg N/yrgeneral agreement (including ICARTT results Hudman et al; 2006) O3 (ppbv) Sauvage et al., ACPD 2006
O3 sensitivity to LiNOx intensity using different satellite observations NO2 SCIAMACHY 6TgN/yr in agreement with model/satellite studyNO2/HNO3/O3Martin et al., JGR, in press6±2Tg N/yr O3 OMI Annual meridional mean HNO3 (200-350hPa) HNO3 (ACE) Model 6TgN/yr 4TgN/yr 8TgN/yr HNO3 (pptv) longitude Simulated HNO3 / LiNOx between 4 and 8TgN/yr No lightning No wave-one pattern W E
Biomass burning emissions constraint O3 sensitivity Savanna fires (SAFARI 2000)
How to use remote-sensed data to constrain emissions? Tropospheric NO2 column ~ ENOx Tropospheric HCHO column ~ EVOC GOME: 320x40 km2 hv O3 NO NO2 lifetime ~ month O3,HO2 NOx lifetime ~ week Free troposphere HNO3 h PBL h NO2 HCHO CO NO OH hours hours O3 O3 VOC HNO3 lifetime ~ hours Lifetime hours Emissions NOx VOC
Space-based constraint on biomass burning emissions: NOx NOx emissions / Tropics: 4.8TgN/yr 5.8TgN/yr GOME NO2 Constrained model NO2 original model NO2 DJF MAM JJA SON 1015 molec cm-2 Better spatial correlations between GOME and model NO2 columns R2 > 0.86 Better agreement during biomass burning season
Space-based constraint on biomass burning emissions: VOC GEOS-Chem tropospheric HCHO presented systematic bias with GOME over biomass burning region Tentatively attribute bias to HCHO and alkenes biomass burning emissions 1-Evidence of higher reactive VOC EF from literature
Space-based constraint on biomass burning emissions: VOC 2-Bias not corrected using MEGAN Seasonal HCHO tropospheric columns (1016 molecules/cm2) GEOS-Chem with MEGAN 2000 GOME 2000 Use of GOME HCHO to constrain VOC over biomass burning regions
Space-based constraint on biomass burning emissions: VOC GOME HCHO fires VOCemissions : HCHO and alkenes increased x 2 GOME HCHO Contrained model HCHO original model HCHO Better agreement during biomass burning season Better spatial correlations between GOME and model HCHO columns R2> 0.7
O3 sensitivity to fire emissions (NOx and VOCs) Lagos Nigeria DJF Abidjan Ivory Coast DJF Original Constraint In Situ Pressure (hPa) Pressure (hPa) O3 (ppbv) Congo-Brazzaville JJA Top-down improves lower tropospheric O3 from 5-20 ppbv during biomass burning season Main influence over Africa DJF-JJA; India MAM Pressure (hPa) Model problems in reproducing meso scale processes (monsoon flow)
Convection effect GEOS3/GEOS4 Convection affects vertical distribution of species, especially in the outflow Detrainment and entrainment (upward+downward) / cloudy column 20S-20N entrainment detrainment Deep outflow layer GEOS4 Liu et al; 2006; Wu et al;2006; Folkins et al., 2006
Role of convection: chemical species as convection tracers MOZAIC GEOS4 GEOS3 RH (%) CO (ppbv) MOZAIC transect Further comparison with daily flights Latitude (25S-25N) Latitude (25S-25N) ITCZ Convection tracers (ITCZ) O3- / RH + / CO + O3 (ppbv) • GEOS3 weak deep outflow / Weak convective detrainment Latitude (25S-25N)
GEOS3 vs GEOS4 Pressure (hPa) In situ GEOS 4 GEOS 3 Ozone (ppbv) RH (%) • GEOS3 weak deep outflow • Convection affects ozone but also Li-NOx does (vertical placement) and radiative effect (photolysis frequencies)
3. What controls O3 maximum in the Atlantic? O3 maximum ?
Atlantic O3 budget/ Sensitivity to sources O3 sensitivity to NOx emissions NOxdecreased by 1% for each source (non linear chemistry) ΔO3 tropospheric 4TgN/yr 3TgN/yr 5TgN/yr DJF SON ΔDU Lightningmain tropical and Atlantic influence / Surface sources local influence Influence on the Atlantic (no emissions): LiNOx: >36% tropicalAtlanticO3 Soils >7%; Fires > 9% …half of lightning (despite similar NOx intensity) ’Background’ 30% Lightning Ozone Production Efficiency (OPE)= 3 time each surface source OPE
Atlantic O3 budget / sensitivity to regions Sensitivity to decreasing NOx emissions by 1% over regions ΔO3 tropospheric >20% >15% >6% DJF MAM JJA SON ΔDU
“zonal-wave one” South Am. Africa subsidence Zonal/Vertical cross-section / O3 (ppbv) O3 flux (kg/s) DJF MAM JJA SON
Dynamic of the O3 maximum Meridional Transport SHADOZ+ MOZAIC 1994-2005 S. Am. Africa NOx ppb 1/Surface emissions of O3 precursors 2/Injection of NOx into the MT-UT with lightning emissions and uplift into ITCZ 3/O3 buildup during transport and subsidence over South Atlantic high area 4/ zonal transport ATLANTIC AFRICA S N O3 (ppbv) O3 (ppbv) Zonal transport Model 2000 O3 ppb
Oxidizing capacity of the tropical troposphere Spivakovsky et al. (2000): Tropical OH: 1.41 106 molec cm-3s-1 (climatologies) Model over estimation by 6% LiNOx dominates oxidizing capacity within the Tropics (>35% vs >26% for total surface sources)
Conclusions: processes driving the O3 max NOx surface sources > 21% > 36% STE ~ 6% AFRICA >20% EAST >6% >15% South America Engine: convergence & subsidence Fuel: in majority Li-NOx, with higher OPE
Randall V. Martin, Aaron van Donkelaar, Ian Folkins, Dalhousie University Paul I. Palmer, Edinburgh University Kelly Chance, Xiong Liu Harvard-Smithsonian May Fu, Shiliang Wu, Bob Yantosca and all the GEOS-Chem community Harvard University MOZAIC team, LA, FZJ Meinrat.O. Andreae, MPI Dennis Boccippio, Jerry Ziemke, NASA Anne M. Thompson, Pennsylvania University Peter Bernath, Toronto University Lyatt Jaeglé, Washington University Supported by NASA atmospheric composition program Acknowledgements :