Download
1 / 16
160 likes | 344 Views
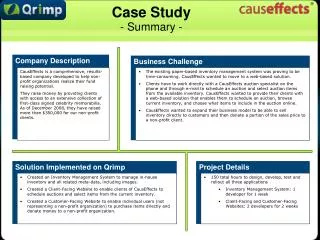
Business Case Summary. June, 1993. Approach & Assumptions. Financial information was gathered from XXXX historical results (1Q93) and published projections Numbers used in estimated benefits calculations were validated with numerous XXXCI financial work-withs

E N D
Business CaseSummary June, 1993
Approach & Assumptions • Financial information was gathered from XXXX historical results (1Q93) and published projections • Numbers used in estimated benefits calculations were validated with numerous XXXCI financial work-withs • Estimated benefits were assessed within the context of the findings • Opportunities identified were quantified and validated with the appropriate XXXX individuals • Estimated benefits are quantified conservatively by design and effort was made to ensure double-counting did not occur • 1350 employees are involved in the product development process1 • Calculations involving employee costs per year (220) use the following numbers2 • Low: $ 65,000 per year (salary) • Medium: $ 87,000 per year (salary + benefits + RE) • High: $156,000 per year (fully loaded employee cost) 1 Gemini Activity Map; validated by Margaret Burke 2 SRCI 1Q93 Financial Reports; validated by Paul Douglas, Margaret Burke and Mike Lowe
Current State of Business Raises Concerns With XXXX’s Ability to Support These Owner Company Challenges • A $36M gap between funding and project expense still exists • Additional over-runs in excess of $25M were identified • Underspending on key programs is a key issue • Measures and key performance indicators are unclear • The budget process is disconnected • There is a lack of competitive focus and strategic direction
Findings From the A&D Identify Opportunities to Meet These Challenges
Protecting Share & Growing New Business Will Require Significant Change As Is To Be How Slow - to - market with product introductions World class product development cycle time CPPD process re-engineering T a n g i b l e Unfocused development efforts Mobilization against critical deliverables Portfolio Governance Re-engineering Activity duplication Clear, efficient roles and responsibilities Organization effectiveness/process re-engineering implementation Lack of decision support systems Best In Class project management/KSI systems Management support system development Competitively reactive Visionary market leader Leadership development I n t a n g i b le Under-leveraged leadership Dynamic leadership, actively displayed and acknowledged throughout organization Leadership development Low morale Invigorated, empowered workforce Cultural change through project role modeling; Organizational effectiveness implementation
New Product #1 New Product #1 New Product #1 Specifically, XXXXX Must Address the Following Areas Cycle Time Reduction Portfolio Prioritization New Product #3 New Product #2 Resource Optimization Procurement Management • Duplication • Increased Efficiency • Increased Effectiveness • Leveraged Resources
Sample Screening Uncovers Potential Redeployment of $2.3-5.7M Worth of Employee Resources Sample Portfolio Screening Results Sample projects screened Low Medium High Projects failing screening process 8 8 8 Product development employees dedicated to sample projects 35 35 35 Employee cost $65K $87K $156K Financial impact $2.3M $3.0M $5.7M Opportunity range $2.3M - $5.7M Potential opportunity after screening entire portfolio Low Medium High Total Product Development employees 1350 1350 1350 Estimated percent of sample projects failing screen* 5% 5% 5% Employee cost $65K $87K $156K Financial impact $4.4M $5.8M $10.5M Additional analysis must be undertaken to determine which products out of the entire portfolio represent redeployment opportunities * Results in past Gemini projects have shown prioritization opportunities ranging from 5-75%
Diagnostics Uncovered Product Development Delays Relating to ... Gating Process Technical Misalignments Governance Process Ineffective Product Management Capital Funding Vendor Commitments Project Delays Misalignment with ODA Non-Value Added Time Opportunities for cycle time reduction were found in all segments of the value chain
Aggregate Findings Indicate A 12-18 Month Reduction in Cycle Time Is Possible Average Cycle Reduction Opportunity: 2.7 - 3.0 mos. 1 - 1.5 mos. gating 1 mos. technical misalign 3 mos. non-value time 6 mos. AIMS.911 2.8 - 5.1 mos. 1 - 1.5 mos. gating 1 mos. technical misalign 3 mos. non-value time 6 - 15 mos. Enhanced Card Services 5.4 - 9.4 mos. 1 - 1.5 mos. gating 1 mos. technical misalign 3 mos. non-value time 3 - 9 mos. AIN 12 - 24 mos. Frame Relay 12 - 18 mos. Access Node • 1.9 - 2.7 mos. • 1 - 1.5 mos. gating • 1 mos. technical misalign • 2 mos. ineffective project • management • 3 - 8 mos. vendor commitments • Centrex low end display terminal • Vantage 48 Key systems • Universal terminal Specific Areas of Cycle Delays: Sources: All A&D diagnostics
Diagnostics Uncovered a Less Than Optimal Usage of Resources Throughout the Product Development Value Chain Ineffective projects - lack of market focus Duplication of work among PMGs Duplication of planning Inefficiency from continuous portfolio rationalization Duplication of ODA/SRCI work Product management inefficiency Technology push inefficiency Rework Inadequate screening process/procedures Project management inefficiency
Optimizing Resources Could Yield More Than $5M Non-optimized resources mapped against PD&I value chain People Impact ($M) 12-13 $1.0M-$1.2M Duplication of planning, projects and other efforts among PMGs 13-22 $1.2M-$1.9M Project management inefficiency/churn 9-18 $0.8M-$1.5M Ineffective screening of projects Duplication of ODA/SRCI work 26-29 $2.3M-$2.5M Prioritization of ODA/SRCI work Overall Impact – 61.3-81.8 $5.3M-$7.1M Source: White papers, Focus Interviews; PD&I Interviews; Probes
1993 XXXX External Supplier Expense Totaled $173M Telecom $20M RE $12M External R&D $55M ODA $63M Other $23M Thus, 33% of XXXXX’s total budget ($528M) is spent on external suppliers • Source: SRCI PMG Expense breakdown • Nancy Berthiaume (4/27/93), Dave Glenville
XXXX Can Capture Significant Benefits by Putting Procurement Processes In Place to Effectively Manage These Costs • Purchasing department has limited resources • Only one person in the purchasing department • No apparent comprehensive procurement strategy exists • We only attempt to manage non-Bell costs • Heavy reliance on related suppliers often sub-optimizes procurement processes • Gemini experience reveals that 5% overpayment is common in such situations Reducing procurement costs by 5% would yield $9.0M
Intangible Benefits - Building the Base for Success • A stable organization with motivation and movement in one clear strategic direction • Effective and consistent decision making • Improved customer and product focus • A new XXXX culture • Motivated, forward looking workforce with improved employee morale • Effective and appropriate key performance indicators and performance measurements • Improved product quality in the marketplace and increased credibility with customers • Defined and understood interfaces • Set roles, responsibilities and accountabilities • Appropriate organization changes
Implementing A Performance Enhancing Culture Can Provide Significant Financial Benefit The Economic and Social Costs of Low Performance Cultures* (1977 - 1988) 901% 756% 682% 282% 166% 74% 36% 1% Revenue Employment Stock Price Net Income Growth Growth Growth Growth Average for firms with performance enhancing cultures Average for firms with low performance cultures *Source: Kotter, Heskett (1992)
Benefits Summary Expense Reduction & Avoidance and Employee Redeployment will meet or exceed total cost of Gemini fees and expenses by year end 1994 Portfolio Prioritization $50MM+ $5MM+ Cycle Time Procurement Reduction Cost Reduction 12-18 months (Revenue and cost benefits of $30M+) Duplication $9MM+ $5MM+