Download
1 / 13
140 likes | 331 Views
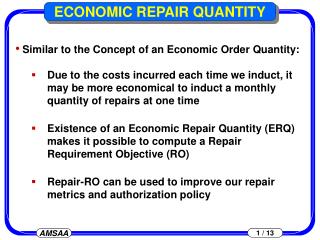
ECONOMIC REPAIR QUANTITY. Similar to the Concept of an Economic Order Quantity: Due to the costs incurred each time we induct, it may be more economical to induct a monthly quantity of repairs at one time

E N D
ECONOMIC REPAIR QUANTITY • Similar to the Concept of an Economic Order Quantity: • Due to the costs incurred each time we induct, it may be more economical to induct a monthly quantity of repairs at one time • Existence of an Economic Repair Quantity (ERQ) makes it possible to compute a Repair Requirement Objective(RO) • Repair-RO can be used to improve our repair metrics and authorization policy
ERQ CONCEPT Economic ORDER Quantity Economic REPAIR Quantity • Quantity economical to Procure at the Reorder Point • Used to provide an economical tradeoff between Holding Cost and Admin Procurement Cost • Larger EOQ = Increased Holding Cost • Smaller EOQ = Increased Admin Cost • Quantity economical to Repair at the RAP • Used to provide an economical tradeoff between Holding Cost and Repair Induction Costs • Larger ERQ = Increased Holding Cost • Smaller ERQ = Increased Induction Cost • Repair induction costs may include: • MSC/IOC/Depot Admin costsassociated with authorizingrepair funds/scheduling/etc. • DLA Issue & Receipt Charges • Repair Shop Set Up costs Cost Holding Induction ERQ
2 * Induction Cost * AMD * (1-ReplacementRate) Cost to Repair * Holding Cost Rate AMD Washout rate Repair cost Holding cost ERQ COMPUTATION Induction cost ERQ Months AMD * (1-ReplacementRate) Larger ERQ for smaller $ Value repair programs Replacement Rate) Larger ERQ for smaller Holding Cost Rate
ASSETS vs. REORDER POINT • Reorder Point used to decide when to Buy • Buy when Assets ≤ Reorder Point Assets Reorder Point Due-in from Repair & Procurement Protected War Reserves Net Procurement Lead Time Demand Serviceables On-Hand Unserviceables On-Hand Safety Level Empirical Safety Level = [(EOQ/2) +SL] x [Procurement Lead Time / 60 months]
ASSETS vs. REPAIR ACTION POINT • Repair when Applicable Assets ≤ Repair Action Point Applicable Assets Repair Action Point Applicable Due-in from Repair & Procurement Protected War Reserves 1 month Gross Demand Gross Repair Lead Time Demand Serviceables On-Hand Safety Level
EOQ (Order Qty) ERQ (Repair Qty) TWO SAFETY LEVELS Acquisition Price Procurement Leadtime SLprocurement Reorder Point Replacement Demand Rate Repair Price Repair Leadtime SLrepair Repair Action Point Repair Demand Rate
OVERVIEW OF REPAIR ACTION POINT • Don’t want to induct Too Soon: • Incur unnecessary additional Holding Cost • Don’t want to induct Too Late: • Incur Backorders • So what’s the latest we can wait to repair without incurring backorders ?? • In a Perfect World: • Wait until we have just enough units left to fill demand during RLT • Repair Action Point = RLT * AMDRLT = Repair Lead Time in monthsAMD = Average Monthly Demand • In the Real World: • Add a Safety Level to protect against uncertainty in RLT and AMD • Repair Action Point = ( RLT * AMD ) + SL • Repair-SL considers just repair variability / repair costs WHOLESALE: REPAIR RETAIL:
THEORETICAL INVENTORY MANAGEMENT PROCUREMENT DECISIONS: Assets Economic Order Quantity Net LeadtimeDemand BUY Reorder Point = SL + Time Jan Feb Mar REPAIR DECISIONS: Applicable Assets REPAIR Repair ActionPoint Gross LeadtimeDemand = SL + REPAIR Time Jan Feb Mar
SL Net PLT Demand Single Item PROCUREMENT-SL vs. ASSETS • The Procurement-Safety Level is used to calculate the Reorder Point • The Reorder Point + EOQ is the level we Buy up to • Therefore, a larger Procurement-SL means more Assets Due-In Service. Assets Due-In Assets SL Reorder Point Service. Due-In Assets SL Unserv. Service. Due-In SL Service. Unserv. Net PLT Demand Net PLT Demand Net PLT Demand Unserv. Unserv. Smaller SLprocure Larger SLprocure SLprocure = Million
TWO COMMON QUESTIONS Q1:Is the Repair Safety Level always larger than the Procurement Safety Level ? A1: No Q2: Doesn’t more Safety Level always mean more Inventory ? A2: No
Single Item REPAIR-SL vs. ASSETS • The Repair-Safety Level is used to calculate the RAP • The RAP is used to decide when to Repair • A larger Repair-SL just means we induct more quickly • A different mix of Serviceables and Unserviceables • But the same Reorder Point, and the same average Assets Assets Assets Assets Assets Due-In Due-In Due-In Due-In Reorder Point Service. Service. Service. Service. Unserv. Unserv. Unserv. Smaller SLrepair Larger SLrepair SLrepair = Million
Repair-Requirement Objective Repair-RO Economic Repair Qty 73 RAP 1 Mon Dem 35 RLT Demand 108 Repair-SL 106 War Reserv. 50