quantity
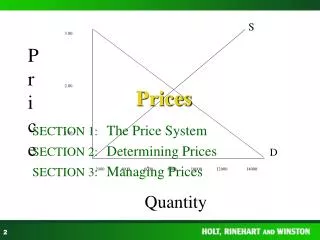
price. demand. B. A. MC. MR. quantity. Figure 9.2. U mon. U opt. Food. Mon. Opt. -slope = MRT. -slope = p m /p f = MRS. ppf. Manufactures. Figure 9.3. U mon. Food. U cou. Mon. Cou. MRT mon. MRT cou. MRS mon. MRS cou. ppf. Manufactures. Figure 9.6. price. demand.

quantity
E N D
Presentation Transcript
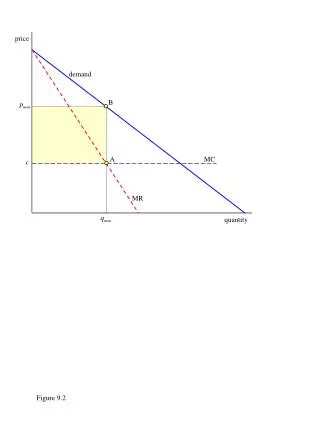
price demand B A MC MR quantity Figure 9.2
Umon Uopt Food Mon Opt -slope = MRT -slope = pm/pf = MRS ppf Manufactures Figure 9.3
Umon Food Ucou Mon Cou MRTmon MRTcou MRSmon MRScou ppf Manufactures Figure 9.6
price demand MRrec MRmon monopoly pmon reciprocal dumping prec Tc c A B qmon qAA qrec quantity imports = qBA profits in autarky increase consumer surplus with trade domestic profits with trade foreign profits with trade -/- net welfare effect Figure 9.7
a. Autarky Belgium 5 million laborers 10,000 varieties produced, 10,000 consumed The Netherlands 7 million laborers 14,000 varieties produced, 14,000 consumed b. International trade Belgium 5 million laborers 10,000 varieties produced, 24,000 consumed 10,000 varieties; 7/12 th of production The Netherlands 7 million laborers 14,000 varieties produced, 24,000 consumed 14,000 varieties; 5/12 th of production Figure 10.6
Variety 1A Variety 1B Variety 2A Variety 2B . . . . . . Variety NA Variety NB Exports from B to A Exports from A to B Consumer country A Consumer country B Figure 10.7
Intermediate 1A Intermediate 1B Intermediate 2A Intermediate 2B . . . . . . Intermediate NA Intermediate NB Exports from B to A Exports from A to B Producers country A Producers country B Consumers country A Consumers country B Figure 10.8
price demand A pmon MC F pworld+t1 B pcomp C E’ D’ pworld+t0 pworld D E MR quantity Figure 11.2
price demand demand’ MC D pquota A B pworld+t C pworld imports MR quantity Figure 11.3
Food U0 ppf U1 Manufactures Figure 12.5
market socialism capitalism Increasing degree of private control A socialism / communism welfare state Increasing degree of private property Figure 12.7
Food ppf B C A Manufactures O E D Figure 12.8
price demand supply pC+t tariff pB+t tariff pC pB imports before customs union imports after customs union q0 q1 q3 q4 quantity decrease producer surplus net gain increase consumer surplus decrease government revenue Figure 13.2
price demand supply pB+t tariff pC+t tariff pB pC imports before customs union imports after customs union q0 q1 q3 q4 quantity decrease producer surplus -/- net gain; possible loss increase consumer surplus decrease government revenue Figure 13.3