Lean, Systems Thinking & Cost Estimation
Massachusetts Institute of Technology. Lean, Systems Thinking & Cost Estimation. Dr. Ricardo Valerdi Dec 15, 2010 MIT Harvard Club de Colombia/IMOCOM Metropolitan Club, Bogotá , Colombia. Theory is when you know everything, but nothing works.

Lean, Systems Thinking & Cost Estimation
E N D
Presentation Transcript
Massachusetts Institute of Technology Lean, Systems Thinking & Cost Estimation Dr. Ricardo Valerdi Dec 15, 2010 MIT Harvard Club de Colombia/IMOCOM Metropolitan Club, Bogotá, Colombia
Theory is when you know everything, but nothing works. Practice is when everything works, but no one knows why. MIT is where theory and practice come together... Nothing works and no one knows why. - on the door of a laboratory at MIT
Roadmap Lean Simulation Systems thinking and systems engineering COSYSMO Valerdi, R., The Constructive Systems Engineering Cost Model: Quantifying the Costs of Systems Engineering Effort in Complex Systems, VDM Verlag, 2008
MIT • OpenCourseWare – 2,000 free courses online (ocw.mit.edu), 100 million visits • Prof. Peter Diamond, Nobel Prize in Economic Sciences • David H. Koch Institute for Integrative Cancer Research (Bldg 76)
1993 Genesis of the Lean Advancement Initiative U.S. Air Force asked: Can the concepts, principles and practices of the Toyota Production System be applied to the military aircraft industry? Yes!
1885 1955-1990 1993-... Craft Production Toyota Production System Lean Enterprise Worker as problem solver Worker as process owner enabled by:-- Training-- Upstream quality-- Minimal inventory-- Just-in-time Eliminate waste Responsive to change Machine then harden Fit on assembly Customization “Lean” applied to all functions in enterprise value stream Optimization of value delivered to all stakeholders and enterprises in value chain Highly skilled workforce Low production rates High cost Low cost Improving productivity High quality product Greater value for stakeholders Low cost Improving productivity High quality product Historical Industrial Paradigms 1913 Mass Production Parts inter-changeability Moving production line Production engineering “Workers don’t like to think” Unskilled labor High production rates Low cost Persistent quality problems Inflexible models “Lean” is elimination of waste and efficient creation of enterprise value
We Share A Goal: We Share A Goal: Enterprise Excellence
LAI Operating Model Knowledge Exchange Events • Workshops, seminars, roundtables & tutorials • A membership benefit via point system • Available to customers, suppliers and consultants • Events are self-supporting Transformation Events DEPLOYMENT • Enterprise transformation focus • Enterprise level training • Roadmap for Enterprise transformation • Fee for service model Enable Transformation Exchange Knowledge Measure Value Educational Network • Learn from doing • Research validated • Impacts future research • Contributed SMEs • Learn from doing • Collaborations Create collaborativevalue for customers EnhanceMembership Expand Lean knowledge KNOWLEDGE CREATION RELATIONSHIPS • Benchmarking • Sharing Lessons Learned • Neutral broker • Website • Active community of practice • Annual Conference Accelerate Deployment • Applied research • Best practices • Transformation strategies • Change management • Future enterprise design Conduct Enterprise Research Engage all Stakeholders Collaborate to Transform Develop Transformation Products • Access • Knowledge transfer • Collective action Products and tools Publications
Lean Enterprise Value Simulation • A simulation of a complex aerospace enterprise • Philosophy draws heavily on LAI research and the recent book Lean Enterprise Value • Content and cases based on LAI member experience
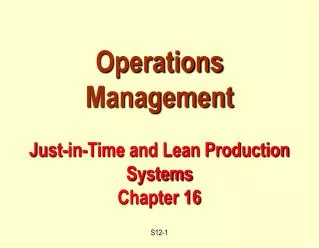
Best Quality — Lowest Cost — Shortest Lead Time Best Safety — High Morale Through shortening the production flow by eliminating waste People and Teamwork • Just-in-Time • Right part, right amount, right time • Takt time planning • Continuous flow • Pull system • Quick changeover • Integrated logistics • Jidoka • (in-station quality) • Make problems visible • Automatic stops • Andon • Person-machine separation • Error-proofing • In-station quality control • Solve root cause of problems (5 whys) • Selection • Common goals • Ringi decision making • Cross-trained Continuous Improvement Waste Reduction • Genchi Genbutsu • 5 whys • Eyes for waste • Problem solving Leveled Production (heijunka) Stable and Standardized Processes Visual Management Toyota Way Philosophy Toyota Production System From Liker, Jeffrey, The Toyota Way, McGraw Hill, 2004, p. 33
Value Added Activity Any activity that transforms or shapes (for the first time) material or information to meet customer requirements Non-Value Added Activity (Waste) Those activities that take time or resources, but do not meet customer requirements Value Added and Non-Value Added Lean relentlessly seeks to eliminate any processes or activities that don’t contribute to something valued by the customer (or stakeholders in the enterprise)
5 S Before • Sort • Straighten • Scrub • Systematize • Standardize After A prerequisite for establishing visibility of wastes and visual control Photos from John Tile, BAE Systems, The Distributed Leadership of Lean to the Office & Engineering Environment, LAI Plenary Conference, April 2006
5 Whys—Root Cause Analysis Root cause analysis can be exhaustive! • Portion of 32-page example shown here
Manufacturing Suppliers Engineering Customer Acceptance Plant B Plant A Design Change Request Final Assembly 2nd Tier 1st Tier Plant C Design Analysis Engineering required to redesign plane or production system Verification Systems Engineering Design In/Out Box Design Analysis
MFG Table Customer Plant ATail Plant D Final Assy Plant C Wings Plant BFuselage
Mfg Table Plant A Tail Build to Specification Mat A 1 2X8 White Plate 2 2X4 White Bricks 1 2X2 White Brick 2 1X2 Lt Grey Bricks 1 2X3 Black Slope • Source parts come from suppliers • Finished assembly has 7 total parts • Feeds to assembly in Plant B (fuselage)
Mfg Table Plant D Final Assy Build to Specification Mat D 2 Wing Assy (Plant C) 1 Fuselage (Plant B) • Source parts come from other plants • Finished assembly has 3 assemblies (38 total total parts in initial state) • Ships to customer test/acceptance
and how to do it: MAT Process Complexity Hourglass Seconds 1 30 2 60 3-4 120 5-6 180 Review Tells you what to do: ≤ 3 + To pass, roll one die and score ≤ 3 + number of yellow dots on job
Process Complexity Hourglass Seconds 1 60 2 120 3 180 ≤ 2 + + Different mats have different rules Review To pass, roll one die and score ≤ 2 + number of red and blue dots on job
Profit Profit Profit Profit # Parts # Parts # Planes cap $price $price cap $price cap # jobs cap $price/job # outside jobs Enterprise Optimization • Capacity balance, stability will maximize production • Financial balance (win-win-win) through transfer pricing • Multiple stakeholders and value streams • Identify key leverage points for performance and balance
Return on Invested Capital Sales Gross Profit -Recurring Expenses Operating Profit =ROIC -Operating Costs Invested Capital
Manufacturing Cost Distribution • Healthy • Low deadweight • Carrying costs reasonable • Parts are biggest cost - assembling them is added value
PD Cost Distribution • Not good • Deadweight and Penalties • Carrying costs large • Variable cost (dots = engineering work) smaller
SN Cost Distribution • So-so • Deadweight and Penalties OK • Carrying costs large • Total costs >> Variable costs
Enterprise Cost Distribution • Roll up—NOT an average • Carrying and other costs overwhelm true variable costs (raw material and engineering talent) • March on Moscow effect evident… • Not obvious from this representation where is the value is being dissipated
Financial Data: Typical Manufacturing Cost Distribution • Round 2 • Financially OK- made 3 planes at high cost and price • Costs all over the place
Local Lean • Round 6 • Six Aircraft • Less deadweight and penalties • Higher % variable costs • Lower price
Enterprise Lean • Round 11 • 11 Aircraft • Very little deadweight and penalties • Carrying costs diluted across more planes • Much lower price, high profit
Systems Thinking Davidz, H. L. and Nightingale, D. J. “Enabling Systems Thinking To Accelerate the Development of Senior Systems Engineers,” Systems Engineering, Vol. 11, No. 1, 2008. “Utilizing modal elements to consider the componential, relational, contextual, and dynamic elements of the system of interest.”
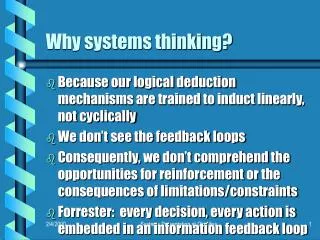
Systems Thinking: A Latent Construct • Five learning disciplines (Senge 1990) • Personal mastery, mental models, shared vision, team learning and systems thinking • Seven critical skills of systems thinking (Richmond 1993) • Dynamic, closed-loop, generic, structural, operational, continuum, and scientific • Thirty systems thinking laws (Frank 2000) • Synergy, gradual process, life-cycle thinking, solution exploration, etc. • Four foundations of systems methodology (Gharajedaghi 2006) • Holistic thinking, operational thinking, systems theories and interactive design
Systems Thinking Competencies 1. Ability to define the “universe” appropriately – the system operates in this universe 2. Ability to define the overall system appropriately – defining the right boundaries 3. Ability to see relationships – within the system and between the system and universe 4. Ability to see things holistically – within and across relationships 5. Ability to understand complexity – how relationships yield uncertain, dynamic, nonlinear states and situations 6. Ability to communicate across disciplines – to bring multiple perspectives to bear 7. Ability to take advantage of a broad range of concepts, principles, models, methods and tools – because any one view is inevitably wrong
“Maybe pushing on that wall to the right will give some space.”
Sjors Witjes, Pablo Muñoz Specht, Carolina Montoya Rodríguez, The Measurement of the Development of Systems and General Thinking in Agricultural Areas of Colombia: Preliminary Results, Los Andes University.
Systems Engineering “An interdisciplinary approach and means to enable the realization of successful systems. It focuses on defining customer needs and required functionality early in the development cycle, documenting requirements, then proceeding with design synthesis and system validation while considering the complete problem.” - International Council on Systems Engineering (www.incose.org)
Systems Engineering • Product Realization • Implementation Process • Transition to Use Process • Technical Evaluation • Systems Analysis Process • Requirements Validation Process • System Verification Process • End Products Validation Process • Acquisition and Supply • Supply Process • Acquisition Process • Technical Management • Planning Process • Assessment Process • Control Process • System Design • Requirements Definition Process • Solution Definition Process EIA/ANSI 632, Processes for Engineering a System, 1999.
COSYSMO Origins Systems Engineering (Warfield 1956) 1950 Software Cost Modeling (Boehm 1981) 1980 CMMI* (Humphrey 1989) 1990 *Capability Maturity Model Integrated (Software Engineering Institute, Carnegie Mellon University) Warfield, J. N., Systems Engineering, United States Department of Commerce PB111801, 1956. Boehm, B. W., Software Engineering Economics, Prentice Hall, 1981. Humphrey, W. Managing the Software Process. Addison-Wesley, 1989.
COSYSMO Scope • Addresses first four phases of the system engineering lifecycle (per ISO/IEC 15288) • Considers standard Systems Engineering Work Breakdown Structure tasks (per EIA/ANSI 632) Conceptualize Operate, Maintain, or Enhance Replace or Dismantle Transition to Operation Oper Test & Eval Develop
COSYSMO Operational Concept # Requirements # Interfaces # Scenarios # Algorithms + 3 Adj. Factors Size Drivers COSYSMO Effort Effort Multipliers • Application factors • 8 factors • Team factors • 6 factors Calibration
COSYSMO Model Form Where: PMNS = effort in Person Months (Nominal Schedule) A = calibration constant derived from historical project data k = {REQ, IF, ALG, SCN} wx = weight for “easy”, “nominal”, or “difficult” size driver = quantity of “k” size driver E = represents diseconomies of scale EM = effort multiplier for the jth cost driver. The geometric product results in an overall effort adjustment factor to the nominal effort.
UNDERSTANDING FACTORS Requirements understanding Architecture understanding Stakeholder team cohesion Personnel experience/continuity COMPLEXITY FACTORS Level of service requirements Technology Risk # of Recursive Levels in the Design Documentation Match to Life Cycle Needs OPERATIONS FACTORS # and Diversity of Installations/Platforms Migration complexity Cost Driver Clusters • PEOPLE FACTORS • Personnel/team capability • Process capability • ENVIRONMENT FACTORS • Multisite coordination • Tool support
Stakeholder team cohesion Represents a multi-attribute parameter which includes leadership, shared vision, diversity of stakeholders, approval cycles, group dynamics, IPT framework, team dynamics, trust, and amount of change in responsibilities. It further represents the heterogeneity in stakeholder community of the end users, customers, implementers, and development team.