Download
1 / 8
80 likes | 245 Views
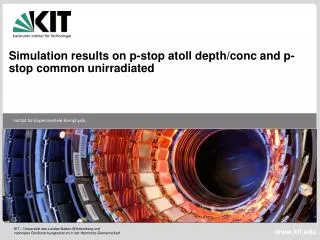
Simulation results on p-stop/p-spray depth/conc. Crosscheck of HPK workshop Jan 2013 talk of W. Trebersburger (HEPHY Vienna). Comparison of SRP measurements at HEPHY. ~ Jan. 2013: N-strip: 1-2e19 cm -3 , d=2.2 um P-stop: 4e15 cm -3 , d=1.6 um P-spray: 1e15 cm -3 , d=1.5 um.

E N D
Simulation results on p-stop/p-spray depth/conc Crosscheck of HPK workshop Jan 2013 talk of W. Trebersburger (HEPHY Vienna)
Comparison of SRP measurements at HEPHY • ~ Jan. 2013: • N-strip: 1-2e19 cm-3, d=2.2 um • P-stop: 4e15 cm-3, d=1.6 um • P-spray: 1e15 cm-3, d=1.5 um Fig.: SPR measurements of doping profiles for n-strips and p-stop isolation presented at HPK workshop at CERN in Jan. 2013 (Wolfgang Trebersburg, HEPHY Vienna) Check with help of simulation tool Synopsys T-CAD! • ~ summer 2011: • N-strip: 1e17 cm-3, d=1.4 um • P-stop: ??? • P-spray: 1-2e14 cm-3, d=0.2 um Martin Strelzyk – Simulation results on pstop doping depth and concentation
Interstrip Resistance Electrical conductance C in Synopsys T-CAD corresponds to admittance A per default. Definition of admittance C: C=1/Z with Z= R + iX, where R is the resistance and the imaginary part X is the reactance. Here we assume Z ~ R and hence R = 1/A P-stop conc 1e15 cm^-3 Peak like in Claudio‘s paper 1e16 cm^-3 3e16 cm^-3 6e16 cm^-3 1e17 cm^-3 Q_Ox 1.0e11 cm^-2 P-stop depth 1.0um P-stop width 6.0um N-strip depth 1.0um Bulk doping 3.4e12 cm^-3 Peak not yet understood Sufficient strip isolation only above ~100V Martin Strelzyk – Simulation results on pstop doping depth and concentation
R_int simulated with values from SPR measurements from HEPHY presented at HPK workshop in Jan. 2013 320P type Bulk doping =3.4e12 cm^-3 P-stop conc = 4e15cm^-3 P-stop depth = 1.6 um P-stop width = 6um N-strip depth = 2.2 um Oxide charge varied from 1e11cm^-2 to 3e12cm^-2 Increase of oxide charge due to surface damage caused by radiation accumulates more electrons between adjecent strips R_int decreases Strip isolation strongly depends on surface damage! 1e11cm^-2 3e11cm^-2 increase of Q_Ox decrease of R_int 8e11cm^-2 3e12cm^-2 Martin Strelzyk – Simulation results on pstop doping depth and concentation
sufficient R_int sufficient R_int Q_Ox increases P-stop conc 4e15 cm-2 P-stop conc 1e16 cm-2 • Variation of Q_Ox from • 1e11cm-2 to 2e12cm-2 • 3 different doping concentrations of p-stop pattern sufficient R_int As expected, with higher p-stop conc. R_int is more sufficient at lower V_bias Next: how look the E-fields like? P-stop conc 3e16 cm-2 Martin Strelzyk – Simulation results on pstop doping depth and concentation
p_d = 2.0um p_d = 1.6um Q_Ox = 1e11 cm-2 Q_Ox = 4e11 cm-2 p_d = 1.0um Strip and p-stop concentrations and doping depths taken from SPR measurements presented in Jan. 2013 Increasing of oxide charge leads to R_int values of some Ohm…(instead of GOhm) Deeper p-stop implantation is better in that way, that R_int becomes sufficient at lower voltages with increasing Q_Ox Check of E-field strenghts necessary! Q_Ox = 8e11 cm-2 Martin Strelzyk – Simulation results on pstop doping depth and concentation Now: strip n depth const. 1.0 um and variation of p-stop depth p_d = 1.0, 1.6 and 2.0 um
Now: strip p depth const. 1.0 um and variation of n-strip depth n_d = 1.0, 1.5 and 2.0 um Q_Ox = 1e11 cm-2 Q_Ox = 4e11 cm-2 Strip and p-stop concentrations and doping depths taken from SPR measurements presented in Jan. 2013 Increasing of oxide charge leads to R_int values of some Ohm…(instead of GOhm) It looks like p-stop depth of 1.0 um and a doping conc of 4e15 cm-3 would not guarantee good strip isolation Check of E-field strenghts necessary! Q_Ox = 8e11 cm-2 Martin Strelzyk – Simulation results on pstop doping depth and concentation
Summary R_int simulations give a first feeling of how the strip isolation depends on doping concentrations and doping depths of implants. C_int is not influenced significantly considering doping depths (not shown here). Check of „new“ implant parameters presented at hpk workshop was done. Still no meaningful suggestions for implant parameters possible, because important sensor characteristics like e-field strength and CCE have to be studied. Martin Strelzyk – Simulation results on pstop doping depth and concentation


![[Preliminary Simulation Results on Power Saving]](https://cdn5.slideserve.com/9731281/preliminary-simulation-results-on-power-saving-dt.jpg)