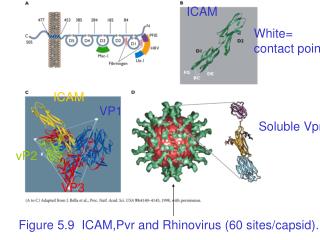
ICAM-1
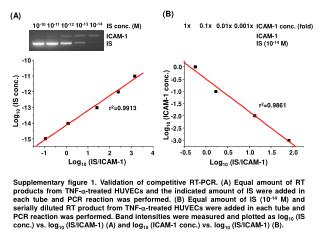
(B). (A). 10 -14. 10 -13. 10 -11. 10 -12. 10 -10. 1x. 0.1x. 0.01x. 0.001x. IS conc. (M). ICAM-1 conc. (fold). ICAM-1. ICAM-1. IS (10 -14 M). IS. -10. 0.0. -11. -0.5. -1.0. -12. Log 10 (IS conc.). Log 10 (ICAM-1 conc.). r 2 =0.9861. -1.5. r 2 =0.9913. -13. -2.0. -14.

ICAM-1
E N D
Presentation Transcript
(B) (A) 10-14 10-13 10-11 10-12 10-10 1x 0.1x 0.01x 0.001x IS conc. (M) ICAM-1 conc. (fold) ICAM-1 ICAM-1 IS (10-14 M) IS -10 0.0 -11 -0.5 -1.0 -12 Log10 (IS conc.) Log10 (ICAM-1 conc.) r2=0.9861 -1.5 r2=0.9913 -13 -2.0 -14 -2.5 -15 -3.0 -0.5 0.0 0.5 1.0 1.5 2.0 -1 0 1 2 3 4 Log10 (IS/ICAM-1) Log10 (IS/ICAM-1) Supplementary figure 1. Validation of competitive RT-PCR. (A) Equal amount of RT products from TNF-a-treated HUVECs and the indicated amount of IS were added in each tube and PCR reaction was performed. (B) Equal amount of IS (10-14 M) and serially diluted RT product from TNF-a-treated HUVECs were added in each tube and PCR reaction was performed. Band intensities were measured and plotted as log10 (IS conc.) vs. log10 (IS/ICAM-1) (A) and log10 (ICAM-1 conc.) vs. log10 (IS/ICAM-1) (B).