Download
1 / 18
180 likes | 338 Views
A Statistical Method for 3D Object Detection Applied to Face and Cars. CVPR 2000 Henry Schneiderman and Takeo Kanade Robotics Institute, Carnegie Mellon University Presented by Zhiming Liu. Outline. Introduction Functional Form of Decision Rule

E N D
A Statistical Method for 3D Object Detection Applied to Face and Cars CVPR 2000 Henry Schneiderman and Takeo Kanade Robotics Institute, Carnegie Mellon University Presented by Zhiming Liu
Outline • Introduction • Functional Form of Decision Rule • Implementation of Detectors: Coarse to Fine Search Strategy • Experiments
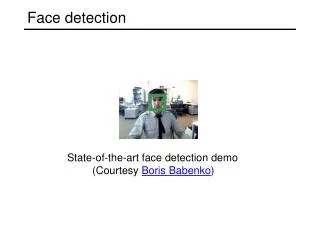
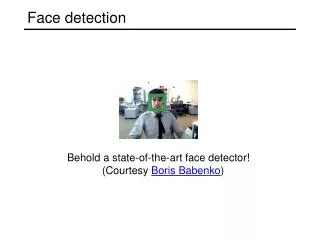
Introduction • The main challenge in object detection: the amount of variation in visual appearance - cars vary in shape, size, color and in small details. - lighting variation. - pose and orientation variation. • View-Based Detectors Separate detectors that are each specialized to a specific orientation of the object.
Introduction The number of orientations to model for each object is empirically determined.
Functional Form of Decision Rule For each view-based detector, we model two statistical distributions, P(image | object) and P(image | non-object)
Functional Form of Decision Rule • Representation of Statistics Using Products of Histograms - difficulty in modeling P(image | object) and P(image | non-object). - choose to use histogram. Estimation of a histogram simply involves counting how often each attribute value occurs in the training data. - use multiple histograms. Each histogram, Pk(patternk | object), represents the probability of appearance over some specified visual attribute, patternk.
Functional Form of Decision Rule - combine probabilities from different attributes.
Functional Form of Decision Rule • Decomposition of Appearance in Space, Frequency and Orientation - first, we decompose the appearance of the object into “parts” where each visual attribute describes a spatially localized region on the object. - we also decompose some attributes in orientation content. - finally, the spatial relationships of the parts is an important cue for detection. With this representation, each histogram now becomes a joint distribution of attribute and attribute position, Pk(patternk(x,y),x,y | object), and Pk(patternk(x,y),x,y | non-object).
Functional Form of Decision Rule • Representation of Visual Attributes by Subsets of Quantized Wavelet Coefficients - the wavelet transform organizes the image into subbands that are localized in orientation and frequency. - within each subband, each coefficient is spatially localized. - use 3 level decomposition wavelet transform, producing 10 subbands.
Functional Form of Decision Rule - each visual attribute is defined to sample a moving window of transform coefficients. for example, 3*3 window of coefficients in level 3 LH band; 2*2 window in the LH and HL bands of the 2nd level.
Functional Form of Decision Rule - overall, we use 17 attributes that sample the wavelet transform in groups of 8 coefficients in one of the following ways: 1. Intra-subband – All the coefficients come from the same subband. These visual attributes are the most localized in frequency and orientation. 7 attributes for the following subbands: level 1 LL, level 1 LH, level 1 HL, level 2 LH, level 2 HL, level 3 LH, level 3 HL.
Functional Form of Decision Rule 2. Inter-frequency – Coefficients come from the same orientation but multiple frequency bands. these attributes represent visual cues that span a range of frequencies such as edge. 6 attributes using the following subband pairs: level 1 LL – level 1 HL, level 1 LL – level 1 LH, level 1 LH – level 2 LH, level 1 HL – level 2 HL, level 2 LH – level 3 LH, level 2 HL – level 3 HL. 3. Inter-orientation – Coefficients come from the same frequency band but multiple orientation bands. these attributes represent cues that have both horizontal and vertical components such as corners. 3 attributes using the following subband pairs: level 1 LH – level 1 HL, level 2 LH – level 2 HL, level 3 LH – level 3 HL.
Functional Form of Decision Rule 4. Inter-frequency / Inter-orientation – This combination is designed to represent cues that span a range of frequencies and orientations. we define one such attribute combination coefficients from the following subbands: level 1 LL, level 1 LH, level 1 HL, level 2 LH, level 2 HL
Functional Form of Decision Rule • Final Form of Detector finally, our approach is to sample each attribute at regular intervals over the full extent of the object, allowing samples to partially overlap. where “region” is the image window we are classifying.
Coarse to Fine Search Strategy • a direct implementation of exhaustive search will take a long time. • use a heuristic coarse-to-fine strategy to speed up this process. - first partially evaluate the likelihood ratio for each possible object location using low resolution visual attributes in level 1 subband. - then only continue evaluation at higher resolution for those object candidates. - search a 320*240 image over 4 octaves of candidate size takes about 1 minute for faces and 5 minutes for cars.
Accuracy of Face Detection with Out-of-Plane Rotation • First successful algorithm for detection of faces with out-of-plane rotation. • Test set: 208 images with 441 faces of which 347 are in profile view.
Accuracy of Car Detection • First algorithm that can reliably detect passenger cars over a range of viewpoints. • Test set: 104 images that contains 213 cars which span a wide variety of models, sizes, orientations, lighting conditions and so on.