Understanding Global Carbon Changes: Impacts & Solutions
340 likes | 450 Views
This chapter discusses key geochemical global changes, such as the ozone layer, methane production, and CO2 accumulation. It covers the sources and lifetimes of methane and CO2 in the atmosphere, as well as the impact of human activities like deforestation and fossil fuel burning on carbon emissions. The text explores the historical concentrations of CO2 and CH4, emphasizing the role of oceans and the biosphere as carbon sinks. It also delves into the mechanisms of oceans as carbon sinks, including thermohaline circulation and chemical forms of CO2 in seawater. Understanding these processes is crucial for addressing climate change and developing sustainable energy sources for the future.

Understanding Global Carbon Changes: Impacts & Solutions
E N D
Presentation Transcript
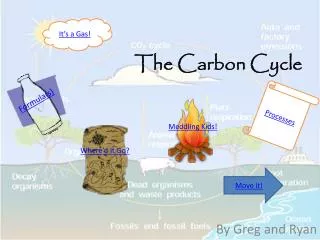
The Perturbed Carbon CycleChapter 10 GEO 307 Dr. Garver
Chapter 10: discusses 3 geochemical global changes; • ozone (SKIP) in stratosphere - sunscreen in troposphere – air pollution 2. Methane • produced by livestock, rice, natural sources • Lifetime in atm ~decade 3. CO2 • Accumulating in atm more slowly than we release it due to uptake by terr. biosphere and oceans. • Oceans easier to quantify (less patchy than land) • Much longer lifetime in atm.
Methane • 20x more powerful gh gas (per molecule) than CO2 (chapter 4) • Has both natural and anthropogenic sources • When released into atm reacts slowly with oxygen to oxidize slowly back to CO2 • Rate of emission + atm lifetime of methane determines concentration of CH4 in atm • Lifetime of a CH4 molecule is ~1 decade
CO2– accumulating more slowly in the atm than we are releasing it because of uptake by the oceans and terrestrial biosphere. • Ocean uptake is easier to quantify (less patchy than land) • Has longer lifetime in atm than CH4so will influence the climate for hundreds of thousands of years into the future • Long term projections of carbon use, compared with stabilizing C use, show that major new carbon free energy sources will be required. • Energy demand will continue to increase.
2 main anthropogenic sources of CO2 to the atmosphere: ?????
2 main anthropogenic sources of CO2 to atm: • Deforestation 1.5 Gton C/yr • Fossil Fuels 8.5 Gton C/yr • These numbers are from current Archer text
Deforestation • Wooded areas hold more carbon than agr. fields. • World’s forests started disappearing thousands of years ago. • 1750 – beg. of anthropogenic CO2 inc. • Temperate forests long gone. • Currently, tropics are where deforestation is.
10.1 – History of CO2 and CH4 concentrations in atm from ice core and atm measurements. 1750
mid-19th century, mahogany works could be found from Panama to Mexico. This depiction of a mahogany gang at work, "Cutting and Trucking Mahogany in Honduras," was used to illustrate an 1851 account, The Mahogany Tree: Its Botanical Character, Qualities and Uses . . . in the West Indies and Central America, by Chaloner and Fleming. From Deforesting the Earth.
Fossil fuels – 8.5 Gton C/yr • rising exponentially, despite inc. energy and carbon fuel efficiency • Combining fossil fuel burning 8.5 Gton C/yrand tropical deforestation 1.5 Gton C/yr= 10 GtonC/yr • But, atm CO2 inventory is rising by 4 Gton C/yr • Where is the other 6 Gton C/yr going? • These numbers are from current Archer text
2 main sinks – oceans & biosphere • Ocean uptake = ~50% (we know this) • Land uptake = ~50% (we assume this) • Terrestrial sink – harder to measure • Distribution of C on land is spotty, hard to quantify • Most C is in the soil • Amt of C in soils depends on recent history of the land • fires, agriculture, erosion, deforestation, climate
Most C is in the soil Amt of C in soils depends on recent history of the land:fires, agriculture, erosion, deforestation, climate
Land is playing 2 roles in the C story • Visible deforestation is source • But, Invisible carbon is a sink • How is land taking up C: • 1. Hypothetically, with inc. T growing seasons will lengthen and land can take up more C • 2. CO2 fertilization – plants grow faster with more CO2 • Could this be a negative feedback for inc. atm CO2? • Studies show initial growth spurt and inc. in CO2 uptake, but then it levels off.
Oceans as a Carbon Sink • Depends on; 1. Circulation of oceans 2. Chemical forms that dissolved CO2 takes in seawater • Importantly, 70% of planet • More homogenous than land, easier to quantify
Thermohaline Circulation • Deep ocean waters only get to the surface in a small area and on very long timescales.
Thermohaline Circulation • Driven by density differences • As opposed to wind-driven currents and tides • Sea water density depends on temperature and salinity, hence the name thermo-haline. • salinity and temperature differences arise from heating/cooling at the surface and from freshwater fluxes (evaporation and sea ice formation enhance salinity; precipitation, runoff and ice-melt decrease salinity).
Densest surface waters – N. Atlantic, Antarctic • Ocean ventilation • Surface waters sink to deep ocean • Carries gases (CO2) • Timescale is centuries
Shallow Ocean • Thermocline – top layer of water where T changes rapidly with depth • This layer exchanges gases with the atm on timescales of decades. • Turbulence helps mix CO2 into surface waters.
Chemical forms of CO2 in seawater • For most gases, the surface ocean layer would equilibriate with the atm in about a month. • Why not CO2 • CO2 differs from other gases in its reactions with water and hydrogen ions. • Hydrogen ions are very reactive • pH (more hydrogen ions = acidic)
Concentration of hydrogen ions is expressed in terms of the pH scale. • Low pH corresponds to high hydrogen ion concentration and vice versa. • A substance that when added to water increases the concentration of hydrogen ions (lowers the pH) is called an acid. • A substance that reduces the concentration of hydrogen ions (raises the pH) is called a base. • Some substances enable solutions to resist pH changes when an acid or base is added. Such substances are calledbuffers. Buffers are very important in helping organisms maintain a relatively constant pH.
CO2 dissolves in seawater and forms carbonic acid H2CO3 CO2 + H2O , H2CO3 • Carbonic acid loses a hydrogen ion to form bicarbonate ion, HCO-3 H2CO3 H+ + HCO-3 • A second hydrogen ion can be released to form carbonate ion, CO=3 HCO-3 H+ + CO=3
The concentration of carbonic acid, bicarbonate and carbonate ions control the acidity of the oceans. CO2 + CO=3 + H2O 2HCO-3 • Seawater has the capacity to absorb or release more CO2 than it would if CO2 had no pH chemistry. • This is because of the C reservoirs of CO=3 and HCO-3 • these buffer any changes to seawater pH, gives it a greater capacity to hold CO2 • Strength of buffer is about a factor of 10, meaning seawater can hold 10x more CO2 than if there were no buffer chemistry
When CO2 dissolves in seawater it makes these ions which is an euqilibirium buffer reaction (the same thing happens in our blood). • CO2 equilibrium in air and water doesn’t care about C in other forms, so C gets ‘hidden’ from the atm by having it change into these 2 ions. • The more that’s hidden, the more CO2 that comes into seawater. • By comparison, O2 has no pH chemistry
Ocean acidification- ongoing decrease in pH of Earth's oceans, caused by uptake of anthropogenic carbon dioxide (CO2) from the atmosphere. • ~30–40% of CO2 released by humans into atmosphere dissolves into oceans, rivers and lakes.
To maintain chemical equilibrium, some CO2 reacts with water to form carbonic acid. Carbonic acid molecules create bicarbonate and hydronium ions, thus increasing "acidity" (H+ ion concentration). • 1751 to 1994: ocean pH decreased from ~8.25 to 8.14, inc. of 30% in H+ ions in world's oceans.
Biology in the Oceans • Biological Pump • Decreases CO2 concentration of surface waters by converting CO2 into organic C via photosynthesis. • Dead phytoplankton sink from surface waters exporting their C to the deep sea.
Atmospheric CO2 fixed by autotrophs in upper ocean is transported to deep waters (i.e. below the mixed layer) by various processes. Phytoplankton die and sink out as aggregatesZooplankton eat phyto.Aggregates decomposed by bacteria. Dissolved organic carbon transported downward during deep mixing events.
Major way to remove carbon from surface waters is carbon-containing pellets excreted by organisms that eat phytoplankton. • Heavy fecal pellets made by animals called salps sink faster than smaller, lighter ones made by euphausiids or copepods.
12 small-scale experiments over the past decade show that iron additions do result in phytoplankton blooms that help draw down carbon dioxide from the air. • But experiments have not determined how much carbon is transferred and sequestered in the deep sea, rather than quickly recycled back to the atmosphere.
Conclusion; • Iron fertilization does in principle work well enough to squirrel away carbon for at least a few decades—possibly useful in the world’s efforts to solve its carbon emissions problem.
Chapter 10: discusses 3 geochemical global changes; • ozone (SKIP) in stratosphere - sunscreen in troposphere – air pollution 2. Methane • produced by livestock, rice, natural sources • Lifetime in atm ~decade 3. CO2 • Accumulating in atm more slowly than we release it due to uptake by terr. biosphere and oceans. • Oceans easier to quantify (less patchy than land) • Much longer lifetime in atm.