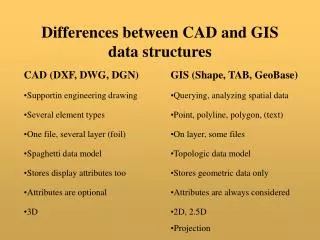
Cartographic and GIS Data Structures
Cartographic and GIS Data Structures . Overview. Map as an Abstraction of Space Database Management system Methods of representing geographic space Raster Model Vector Model. Map as an Abstraction of Space. Spatial features can be represented as point, lines, areas, or surfaces

Cartographic and GIS Data Structures
E N D
Presentation Transcript
Overview • Map as an Abstraction of Space • Database Management system • Methods of representing geographic space • Raster Model • Vector Model
Map as an Abstraction of Space • Spatial features can be represented as point, lines, areas, or surfaces • Some phenomena or objects are selected for inclusion, others are not spatial features and there attributes are simplified, aggregated, and classified • When we want to enter this data into a GIS, certain decisions need to be made based upon how the data can be entered into a computer (geocoding vs. drawing) • How do you get simple spatial concepts into the computer (e.g., a map which identifies a lake within an island, surrounded by ocean, covered by forest on north side, and a cleared beach on the other side) • Inside, surrounded, by, north, south
What is a Database? • A database is a set of computer files that stores information in an organized, structured format • The information is organized in records and fields • Information in a database is related so questions can be asked such as: • List all of the courses that are 4000 level or higher • List the name and address for all people whose last names begin with "T"
Database-continue • 4 basic types of computer database Structures for management of data: hierarchical, network, relational, and object oriented • Database Records and Fields • Record: a small group of related data items (the logical unit of a database) • Field: An individual item of data (contain information that describe records)
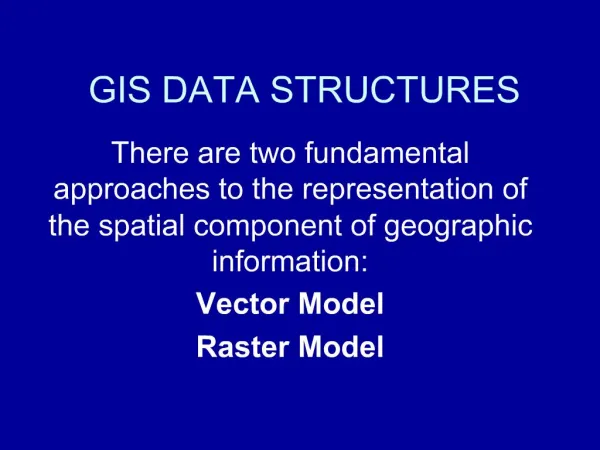
Methods of representing geographic space Vector Raster
The diagram below shows how real-world objects can be represented on a computer monitor by x,y coordinates. The coordinate pairs 1,5 3,5 5,7 8,8 and 11,7 represent a line (road) The coordinate pairs 6,5 7,4 9,5 11,3 8,2 5,3 and 6,5 represent a polygon (lake). The first and last coordinates of the polygon are the same; a polygon always closes.
Raster Models • Raster - from the Greek word meaning "to rake" • Quantizes or divides space into discrete packets (cells), each representing a part of the whole • Cells are of equal size square, rectangular, hexagon, triangles • Loose the ability to represent exact locations (e.g., point represented as single cell) • Zero dimensional object rep. with 2D feature • Lines represented as a series of connected cells • Multiple cells joined at edges or corners, usually with only 1 or 2 neighbors, 1D objects represented in 2D • Areas represented as a series of connected cells • 2D objects represented in 2D, cells distort area and shape - stairs-stepped appearance
Raster Models-continue • Two general ways of associating attribute data with raster entities • 1. store an attribute for every grid cell problem is redundancy in storage • 2. link cells to RDBMS • Permits more than one attribute to be associated for a single cell • Only have to store attributes once • Cell value linked to attribute table • Essentially many to one - "many cells being linked to one record in separate attribute table"
Generic structure for a grid Grid extent Grid cell s w o R Resolution Columns
Geographic Representations • CELLS: a representation of geographic data based on rows and columns (e.g.. continuous surface data such as elevation or temperature, and categorical representations derived from vector data) • PIXELS: a group of independent points with a color value but no other associated data (e.g.. scanned documents, orthophotography, satellite images)
Like the vector data model, the raster data model can represent discrete point, line and area features. A point feature is represented as a value in a single cell, a linear feature as a series of connected cells that portray length, and an area feature as a group of connected cells portraying shape.
Because the raster data model is a regular grid, spatial relationships are implicit. Therefore, explicitly storing spatial relationships is not required as it is for the vector data model.
Vector Models • Features represented in basically the same way as an analog map, permits more precise representation than raster model, permits "empty space”, variations of the vector model • Spaghetti models • Simplest of vector data structures • Does not explicitly store spatial relationships (topology), essentially X,Y coordinates, and which should be connected by lines • Doesn’t really "know" if points and connected lines form a line entity or poly entity • Topological models • Recognizes the concept of an entity • Stores spatial relationship information explicitly associated with each entity, most common in GIS
To keep track of many features, each is assigned a unique identification number or tag. Then, the list of coordinates for each feature is associated with the feature’s tag. The objects you see in a vector theme are actually saved in the theme table
Vector Data: Advantages • Data can be represented at its original resolution and form without generalization. • Graphic output is usually more aesthetically pleasing (traditional cartographic representation) • Since most data, e.g. hard copy maps, is in vector form no data conversion is required. • Accurate geographic location of data is maintained. • Because it recognizes entities, model allows for efficient encoding of topology, and as a result more efficient operations that require topological information, e.g. proximity, network analysis.
Vector Data: Disadvantages • The location of each vertex needs to be stored explicitly • For effective analysis, vector data must be converted into a topological structure. This is often processing intensive and usually requires extensive data cleaning. • Topology is static, and any updating or editing of the vector data requires re-building of the topology • Algorithms for manipulative and analysis functions are complex and may be processing intensive • Often, this inherently limits the functionality for large data sets, e.g.a large number of features. • Continuous data, such as elevation data, is not effectively represented in vector form. Usually substantial data generalization or interpolation is required for these data layers
Raster Data: Advantages • Due to the nature of the data storage technique data analysis is usually easy to program and quick to perform. • The inherent nature of raster maps, e.g. one attribute maps, is ideally suited for mathematical modeling and quantitative analysis. • Discrete data, e.g. forestry stands, is accommodated equally well as continuous data, e.g. elevation data, and facilitates the integrating of the two data types. • Grid-cell systems are very compatible with raster-based output devices, e.g. electrostatic plotters, graphic terminals. • Also compatible with digital satellite imagery.
Raster Data: Disadvantages • The cell size determines the resolution at which the data is represented. • Processing of associated attribute data may be cumbersome if large amounts of data exists. • Raster maps normally reflect only one attribute or characteristic for an area. • Since most input data is in vector form, data must undergo vector-to-raster conversion. • Most output maps from grid-cell systems do not conform to high-quality cartographic needs.
Exercise • Compare between Raster and Vector Model for representing geographic features; illustrate by figures