Insights into Feeding Practices & Household Income from Dairy
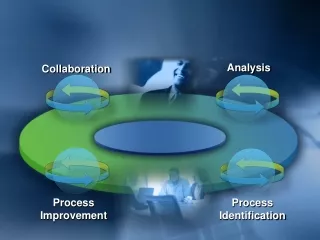
Explore the link between feeding practices & total household income from dairy, including deworming, vaccination, AI practices, learning group impact, and market linkage effects. Discover the relative influence of variables on income and other related insights via complex multivariate models.

Insights into Feeding Practices & Household Income from Dairy
E N D
Presentation Transcript
SDVC Analysis October 2011
Relationship between feeding practices and HH income. There is a significant relationship between feeding practices and total HH income from dairy.F(16)=576.98, p<.00001. This relationship has been modeled using a linear mixed-effects modelwhich controls for phase, year, size of herd, and includes random effects for learning group.
Changes in feeding practices over time Monthly average in Kg used by households at each time point.
The effects of deworming practices on HH income Households that deworm their cattle have significantly higher total HH income from dairy. F(1)=10.52, p=.001. This relationship has been modeled using a linear mixed-effects modelwhich controls for both deworming and vaccination practices, phase, year, size of herd, and includes random effects for learning group.
The effects of vaccination practices on HH income Households that vaccinate their cattle have significantly higher total HH income from dairy. F(1)=10.52, p=.001. . This relationship has been modeled using a linear mixed-effects modelwhich controls for both deworming and vaccination practices, phase, year, size of herd, and includes random effects for learning group.
The effects of AI practices on HH income Households that artificially inseminate their cattle have significantly higher total HH incomefrom dairy. F(1)=17.88, p<.0001. . This relationship has been modeled using a linear mixed-effects model which controls for phase, year, size of herd, and includes random effects for learning group.
The effects of learning group gender composition on HH income Households that have female farm leaders and groups that are all women have significantly higher total HH income from dairy. F(13)=1108.9, p<.0001. . This relationship has been modeled using a linear mixed-effects model which controls for phase, year, size of herd, and includes random effects for learning group. Expected Income depending on gender mix of group Expected Income depending on gender of FL
The effects of market linkage on HH income Households market linkage significantly affects total HH income from dairy. F(8)=45.84, p<.0001. . This relationship has been modeled using a linear mixed-effects model which controls for phase, year, size of herd, and includes random effects for learning group.
The effects of gender and market linkage on HH income The gender of the main FL interacts with HH market linkage to significantly affect total HH income from dairy. F(8)=2.44, p<.01. . This relationship has been modeled using a linear mixed-effects model which controls for phase, year, size of herd, and includes random effects for learning group. Male Main Farm Leaders Female Main Farm Leaders
The effects of the group milk collector on HH income Households that choose their own milk collector have significantly higher total HH incomefrom dairy. F(9)=8.87, p<.0001. This relationship has been modeled using a Linear mixed-effects model which controls for phase, year, size of herd, and includes random effects for learning group.
The effects of the group milk collector on HH income Households that choose their own milk collector have significantly higher total HH incomefrom dairy. The level of satisfaction with the chosen collector also significantly affect total HH income from dairy. F(9)=8.87, p<.0001. This relationship has been modeled using a Linear mixed-effects model which controls for phase, year, size of herd, and includes random effects for learning group.
Relative influence of gender, AI, feeding practices and market linkage on HH income from dairy
Relative influence of gender, AI, feeding practices and market linkage on HH income from dairy This is based on a complex multivariate linear mixed-effects model that controls for time, phase, learning group and all of the variables of interest simultaneously. This chart shows the expected level of income for a HH that is excellentin all other areas. This illustrates the relative influence of the combination of variables. The order of relativeimportance on the HH income Feed Practices(F(3),21.29, p<.0001) Market Linkage (F(6), 63.46,p<.0001) VetPractices(F(2),12.67, p=.0004) AI Practices (F(1),31.51, p<.00001) Sex (F(1), 37.68,p=.00013)
Influence of gender and market linkage on milk collector income Milk collectors income is significantly related to the gender of the collector and the type of market linkage. F(9)=8.87, p<.0001. This relationship has been modeled using a Linear mixed-effects model which controls for phase, year, geographic region, and includes random effects for learning group.
Influence of gender and WBA on livestock health worker income LHW income is significantly related to the gender of the collector and the type of market linkage . F(7)=9.63, p<.0001. This relationship has been modeled using a Linear mixed-effects model which controls for phase, year, geographic region, and includes random effects for learning group.
Influence of Upazila on HH total monthly income from dairy The level of geography that seems to be most related to predicting HH total monthly income from dairy Is Upazila. F(23)=3683.83, p<.0001. This relationship has been modeled using a Linear mixed-effects model which controls for phase, year, geographic region, and includes random effects for learning group.
There is a very strong link between HH access to AI and AI uptakeAs access to AI increases, the probability of the HH using AI increases, p<.0001
There is a very strong link between HH total knowledge score and milk price per litre.As the total knowledge score increases, the predicted milk price increases, p<.0001
There is a link between HH initial knowledge score and how the knowledge score over time affects milk price per litre.There seems to be an interaction effect between the initial knowledge score and the effects of increasing the knowledge score over time. The four different colored lines indicate groups labelled according to their initial knowledge score,
There is a very strong link between the total knowledge score and the probability of getting cattle vaccinated.As the knowledge score increases, the probability of the HH getting the cattle vaccinated increases, p<.0001
Relationship between women owning cattle and women’s total knowledge score There is a significant relationship between the gender of who owns the cattle and women’s knowledgescore. The Pearson correlation is .241, p<.01. And the one-way ANOVA F=486.74, p<.001
Relationship between women owning cattle and decisions to sell cattle There is a significant relationship between the gender of who owns the cattle and who makes the decision to sell cattle. The Pearson correlation is .46, p<.01. Cramer’s V (.464), p<.0001.
Relationship between women owning cattle and permission to attend group and distance meetings There is a significant relationship between women owning cattle and needing permission to attendboth group meetings and distant meetings. The Pearson correlation for attending group meetings is .65, p<.01. Chi-square (4) = 7031, p<.0001. The Pearson correlation for attending distant meetings is .68, p<.001, Chi-square (4) = 7095, p<.0001.
Relationship between HH owning cross-breed cattle and permission to attend group meetings There is not a significant relationship between HH owning cattle and needing permission to attendgroup meetings. The Pearson correlation for attending group meetings is .1, p<.3
Relationship between HH owning cross-breed cattle and permission to attend distant meetings There is not a significant relationship between HH owning cattle and needing permission to attenddistant meetings. The Pearson correlation for attending group meetings is .08, p=.11.
Relationship between women owning cattle, HH owning cross-breed cattle and permission to attend group meetings There is a significant relationship between the interaction of whether not women own cattle, HH who own cross-breed cattle and whether or not women need permission to attend meetings. This plot shows the percentage of women who say they do need permission to attend meetings.