Download
1 / 24
240 likes | 349 Views
Independent Institute for Social Policy. Measurement and analysis of household welfare: possible approaches using GGS data. L. Ovcharova, A. Pishniak, D. Popova. 29.11. 2007. Objective. Developing a comprehensive methodology of measuring household welfare

E N D
Independent Institute for Social Policy Measurement and analysis of household welfare: possible approaches using GGSdata L. Ovcharova, A. Pishniak, D. Popova 29.11.2007
Objective • Developing a comprehensive methodology of measuring household welfare • Expected output: a household welfare index, measuring various dimensions of welfare, which could be used in simulations of demographic intentions
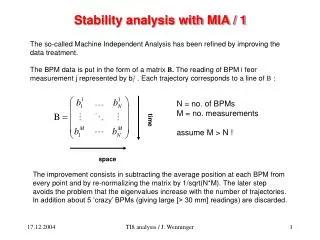
Theoretical approaches Household welfare is measured by 5 domains: • Income • Durables/Property • Basic needs • Housing • Subjective welfare
Income domain • Household income is calculated as a maximum value of: - the sum of separate components of income - total household income estimated by the respondent. • Missing values are imputed on the basis of linear regression model. • Per capita income is adjusted for regional disparities in purchasing power using theratio of the cost of all-Russian subsistence minimum and regional subsistence minimum. • Income outliers are capped.
Other domains • Each domain index consists of a group of indicators • When the household is able to afford the item (indicator) it is awarded the score of 1. If an item cannot be afforded the household is awarded the score of 0. I = Σaixi / Σai *100 Possible approaches to estimate the total household welfare index: A simple count approach A prevalence weighting approach
Durables/property domain: indicators There are 11 indicators available Dish-Washer
Basic needs domain: indicators There are 6 indicators available To keep the house warm enough
Housing domain: indicators • Number of rooms/equivalent household size • Status of ownership (owner/tenant) • Basic utilities (constructed on the base of RLMS, 2004)
Subjective welfare: indicators 2 indicators of subjective welfare are available: 1) Subjective assessment of financial well-being “the ability to make ends meet» - answers “very easy” or “easy” 1 - answers “very difficult” or “difficult” 0 ___________________________________ 2) Satisfaction with the housing – scale 0-10 - answers from 8 to 10 1 - answers from 0 to 2 0
Combining the domain indices into an overall welfare index The analysis of the reliability of the scale was undertaken to show whether all domain indices measure the same variable “household welfare”
Combining the domain indices into an overall welfare index: weighting Weights were generated by single factor analysis. The weights are as follows:
Dependency Load (mean rank) Pensioners Children
Simulation of child birth intentions using the Welfare INDEX Sample: Women under 45 years Dependent variable: Intention to give birth to a child in the next three years Income PC 0.00 0.67 1.00