
Enhancing Machine Independent Analysis through Advanced Data Treatment
This paper presents refined methodologies in Machine Independent Analysis (MIA) for improved stability analysis in BPM data. The data, organized in matrix form, undergoes average position subtraction and re-normalization to mitigate eigenvalue inflation due to trajectory increases. We eliminate outlier BPM readings, enhancing the clarity of the signal above background noise. The resulting decomposition via Singular Value Decomposition (SVD) isolates significant eigenvalues, enabling better identification of meaningful trajectories, notably in stability contexts.

Enhancing Machine Independent Analysis through Advanced Data Treatment
E N D
Presentation Transcript
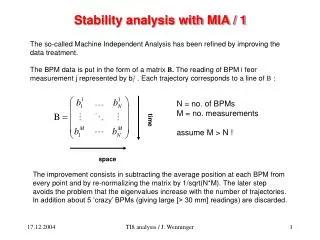
Stability analysis with MIA / 1 The so-called Machine Independent Analysis has been refined by improving the data treatment. The BPM data is put in the form of a matrix B. The reading of BPM i feor measurement j represented by bij . Each trajectory corresponds to a line of B : N = no. of BPMs M = no. measurements assume M > N ! time space The improvement consists in subtracting the average position at each BPM from every point and by re-normalizing the matrix by 1/sqrt(N*M). The later step avoids the problem that the eigenvalues increase with the number of trajectories. In addition about 5 ‘crazy’ BPMs (giving large [> 30 mm] readings) are discarded. TI8 analysis / J. Wenninger
Stability analysis with MIA / 2 The matrix B is then again decomposed by SVD into : • where : • U is a matrix of normalized and orthogonal time patterns. • V is a matrix of normalized and orthogonal space patterns. • W is a diagonal matrix with the eigenvalues of the space patterns. As a consequence of the improved data filtering, large eigenvalues associated with the static trajectory and bad BPM readings are now removed. As a consequence the signal should appear more clearly above the noise. TI8 analysis / J. Wenninger
Eigenvalue spectrum The eigenvalue spectrum in the horizontal plane indicates a clear signal above the noise floor for the first eigenvalue. This eigenvalue corresponds to a trajectory that is compatible with a kick at the septum (as presented at a previous meeting). TI8 analysis / J. Wenninger