Download
1 / 50
500 likes | 590 Views
Uptake of Chemicals into Plants. Lectures by Dr. Stefan Trapp. Stefan Trapp CV 1962 * Germany 1986 dipl geoecology 1992 PhD botany 1998 habil mathematics 1998 DTU applied ecology Modeling of plant uptake and phytoremediation. Lecture today. Part 1: Standard Model

E N D
Uptake of Chemicals into Plants Lectures by Dr. Stefan Trapp
Stefan Trapp CV 1962 * Germany 1986 dipl geoecology 1992 PhD botany 1998 habil mathematics 1998 DTU applied ecology Modeling of plant uptake and phytoremediation
Lecture today Part 1: Standard Model Part 2: Dynamic Cascade Model Part 3:Cell Model Part 4:Translaminar Leaf Model if time: Standard model for ionics
Part 1 Standard Model for Plant Uptake of Organic Compounds I Concepts II Uptake into Vegetation III Exercises
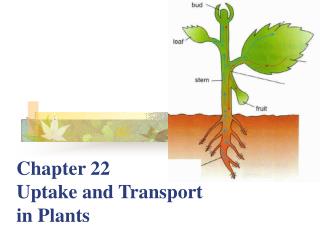
How plants function Roots take up water and solutes Stems transport water and solutes Xylem = water pipe Phloem = sugar pipe Leaves transpire water and take up gas Fruits are sinks for phloem and xylem
Definition “BCF” BCF is “bioconcentration factor” Concentration in plants [mg/kg] BCF = ―――――――――――――――――― Concentration in soil [mg/kg] Take care! BCF differs for - dry weight versus wet weight - with uptake from air - for roots, leaves, fruits, wood
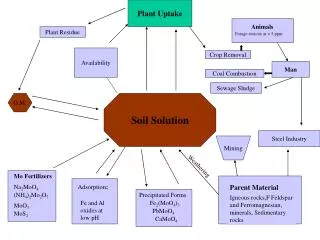
Particle deposition Exchange with air Xylem & Phloem transport Direct soil contact Soil – air plant Translocation in xylem Diffusion Advective uptake with water
BCF: Empirical regression by Travis & Arms Easy to use Gives good results Old (ex-RISK) Problem: only uptake from soil; no air Regression with log KOW for C vegetation to C soil (dry wt.)
Root model mass balance Change of mass in roots = +uptake with water – transport to shoots dmR/dt = CWQ – CXyQ where m is mass of chemical (mg)C is concentration [mg/kg, mg/L]Q is water flow [L/d] index R is roots, W is water and Xy is xylem
From mass to concentration m is chemicals’ mass (mg) M is root mass (kg) C is concentration (mg/kg) C = m / M dmR/dt = d(CR MR)/dt The root grows – integration for C and M required (oh no ...!)
Dilution by exponential growth Chemical mass: m = constant Plant mass: M(t) = M(0) x e+kt m/M = Concentration in plant: C(t) = C(0) x e-kt
Root modelconcentration Change of concentration in roots = + uptake with water – transport to shoots – dilution by growth (rate k) dCR/dt = CWQ/M – CXyQ/M – kCR where k is growth rate [d-1] CXy is concentration in xylem = CR/KRW CW is concentration in soil pore water
Partition constant Root to Water KRW = equilibrium root to water KRW Data by Briggs et al. (1982) for barley log Kow W ca. 0.85 KRW = W + L x KOW0.77
Root modelsolution Mass balance: change = flux in – flux out Concentration: divide by plant mass M Set to steady-state and solve for CR
Root Model result for roots to soil (Csoil = 1 mg/kg) BaP TCE For lipophilic compounds: growth dilution. BCF > factor 100 below equilibrium
Transpiration of plants in Europe Type mm/year mm/dBroad-leaf trees 500-800 4-5Needle trees 300-600 2.5-4.5Corn fields 400-500 Pasture, meadows 300-400 3-6 General rule: About 2/3rd of precipitation is transpired by plants. 1 mm = 1 L/m2
Translocation upwards in the xylem A ”standard plant” transpires 500 L water for the production of 1 kg dry weight biomass! = approx. 50 L per 1 kg fresh weight = approx. 1 L/day for 1 kg plant mass
Translocation upwards in the Xylem For translocation upwards, the chemical must cross the root and come into the xylem. “TSCF” = transpiration stream concentration factor = CXylem/CWater
Definition TSCF TSCF = ”Transpiration stream concentration factor” [mg/L : mg/L] If TSCF is high, good translocation upwards. Two methods: 1) Regression to log KOW (Briggs et al., Dettenmaier et al.) 2) Calculation from root model
Method 1: Regression for TSCF by Briggs (1982) Briggs et al. (1982) = optimum curve
Method 2: Regression for TSCF by Dettenmaier (2009) Dettenmaier et al. = sigmoidal curve
Method 2: Calculation of TSCF with Root Model Model: Lipophilic chemicals (high log Kow) are adsorbed in the root and not translocated
Test of TSCF-Methods Compilation of data from literature Predicted TSCF
Uptake of contaminants into leaves and fruits Leaves and fruits are highly exposed to air Additionally high water flux to leaves (xylem) plus phloem flux (sugar) to fruits Contamination possible from soil and air
Model for uptake into leaves Mass balance: uptake from soil and air + - exchange with air (+ spray application) - dilution by growth - metabolism + influx with xylem
Outflux from roots is influx to leaves and fruits Remember: high for polar compounds (low log Kow)
Leaves – exchange with air Stomata Cuticle
Equilibrium between leaves and air Leaves are plant material, like roots. But they do not hang in soil, and not in water. Leaves hang in air. The concentration ratio between air and water is The concentration ratio between leaves and air is then Because KAW < 1 and KLW > 1 KLA >> 1
The model for leafy vegetables Adapted by the EU in the Technical Guidance Documents for Risk Assessment ”TGD model” Used also by many soil risk assessment models Uptake from soil (via xylem) and from air (or loss to ...) + Exponential growth
Mass balance for the leafy vegetables The change of mass in leaves = + translocation from roots + uptake from air - loss to air growth & degradation from roots from air to air easy to solve: linear diff. eq. of the type
g Conductance leaf - air cuticle way stomata way Estimation of g can be quite complex. It is convinient to use a default value of 1 mm s-1 = 86.4 m d-1.
Mass Balance of Fruits essentially identical to the mass balance in leaves + influx with xylem and phloem + - exchange with air ( + spray application) - dilution by growth - metabolism
Mass balance for Fruits The change of mass in fruits = + flux from xylem and phloem + uptake from air - loss to air growth & degradation from roots from air to air easy to solve: linear diff. eq. of the type
Summary: "Standard Model" A system of coupled linear differential equations where index R is root, W is water, L is soil, F is fruit and A is air. C is concentration (mg/kg), Q is water flux (L/d), M is plant mass (kg), K is partition coefficient (L/kg or kg/kg), A is area (m2), g is conductance (m d-1) and k is rate (d-1).
Uptake from soil into leaves partitioning air-water Accumulation in leaves: polar, non-volatile compounds (such as pesticides, detergents, pharmaceuticals)
Uptake from soil into fruits Accumulation in fruits: less than in leaves, but also polar and non-volatile compounds
Uptake into fruits from air “the usual candidates”: semivolatile lipophilic organic compounds such as PCB, DDT, PAH, PCDD/F
Bioaccumulation of lipophilic chemicals We learned at university (did you ???): ”Lipophilic chemical accumulate via the food-chain” high log KOW high bioaccumulation this is only one out of two mechanisms
Bioaccumulation of hydrophilic compounds from soil in plants A typical plant transpires 500 L water for the production of 1 kg dry weight biomass! = ~ 50 L per 1 kg fresh weight = ~1 L/day for 1 kg plant mass The chemical comes with the water, the water evaporates, the chemical remains. This can lead to a bioaccumulation plant to soil of >>factor 100
Transfer to leaves with attached soil Soil on plant surfaces (Li et al. 1994) [g soil/kg plant dw] Lettuce 260 Wheat 4.8 Cabbage 1.1 Default value: 1% attached soil (wet weight) BCF(leafy vegetables to soil) = BCF model + 0.01
Direct Soil Uptake A ”standard” child eats 200 mg soil a day ”Pica child: 10 grams (acute effects) How much soil do you eat? More than you think ... (1% of 500 g is 5000 mg/d)
Application of the Standard Model The "Standard Model" is the easiest way to calculate the dynamic system soil-plant-air in a "correct way". That's why it is rather popular. It is used by ● EU Chemical risk assessment (TGD, REACH) ● CLEA Contaminated Land Exosure Assessment (UK) ● Csoil (NL) ● RISK (USA) and also ● Teaching at DTU ● Teaching here and now ☺
Limitations of the Standard Model The "Standard Model" is only applicable ● for neutral organic compounds ● for exponentially growing plants ● for steady state Thus it is difficult to simulate real scenarios. It is more a "generic" model. More realistic scenarios can be simulated using the "dynamic cascade model" (see next section).