Download
1 / 21
210 likes | 374 Views
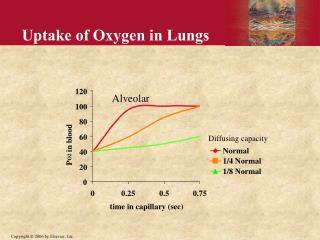
Uptake of Oxygen in Lungs. 120. Alveolar. 100. 80. Diffusing capacity. 60. in blood. Normal. 40. O2. 1/4 Normal. P. 20. 1/8 Normal. 0. 0. 0.25. 0.5. 0.75. time in capillary (sec). Uptake of Oxygen in Lungs with Low Alveolar Po 2. Alveolar. 50. Diffusing capacity. Normal.

E N D
Uptake of Oxygen in Lungs 120 Alveolar 100 80 Diffusing capacity 60 in blood Normal 40 O2 1/4 Normal P 20 1/8 Normal 0 0 0.25 0.5 0.75 time in capillary (sec)
Uptake of Oxygen in Lungs with Low Alveolar Po2 Alveolar 50 Diffusing capacity Normal 1/4 Normal 25 Po2 in blood 1/8 Normal 0 0 0.25 0.5 0.75 time in capillary (sec)
Uptake During Exercise • Increased cardiac output • Decreased transit time • Increased diffusing capacity • Opening up of additional capillaries • Better ventilation/perfusion match • Equilibration even with shorter time
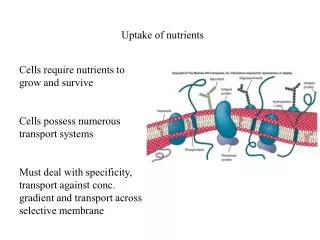
Oxygen Transport • Percent Saturation (no units) HbO2 (Hb+HbO2) • Content (ml O2/100 ml blood) • absolute quantity of oxygen in blood
Transport of Oxygen in Blood • Dissolved oxygen • Solubility 0.003 ml O2/100 ml blood/mmHg • Normal blood 0.3 ml O2 / 100 ml blood at 100mmHg • Normal oxygen consumption ~250 ml O2/min • Would require 83 L/min blood flow • Hemoglobin • 97% transported by HBO2 (oxyhemoglobin) O2 + HB HBO2
Transport of Oxygen in Blood • Hemoglobin • 1.34 ml O2/gm Hb • Normal • 15 gm Hb/100 ml blood • 20 ml O2 /100 ml blood • Anemic • 10 gm Hb/100 ml blood • 13 ml O2 /100 ml blood
Hemoglobin Dissociation Curve 120 20 100 Lungs 80 Content 60 Per cent Saturation 10 Tissue 40 20 0 0 0 20 40 60 80 100 120 PO2
Right Shift of Dissociation Curve Normal 120 100 80 Shift to right 60 Per cent Saturation ¯pH PCO2 Temp 2-3 DPG 40 20 0 0 20 40 60 80 100 PO2
Left Shift of Dissociation Curve Normal 120 100 Shift to left 80 60 Per cent Saturation pH ¯PCO2 ¯Temp ¯2-3 DPG 40 20 0 0 20 40 60 80 100 PO2
Dissociation Curve Values to remember PO2 (mmHg) Saturation (%) Content (ml/dl) 0 0 0 20 25 5 40 75 15 100 100 20 Remember this is for a person with 15 gm/dl hemoglobin
Dissociation Curve myoglobin 120 100 hemoglobin 80 60 Per cent Saturation 40 20 0 0 20 40 60 80 100 120 PO 2
Calculations • Calculate % saturation - Patient has Hb of 10 gm/dl - Venous oxygen content is 6.5 ml O2/dl • Calculate oxygen content - Patient has saturation of 60% - Patient has Hb of 15 gm/dl
Calculations • Calculate % saturation - 10 gm/dl * 1.34 ml O2/gm Hb= 13.4 ml O2/dl - This is max oxygen carrying capacity - (6.5 ml O2/dl) / (13.4 ml O2/dl) = ~50% • Calculate oxygen content - 15 gm/dl * 1.34 ml O2/dl = 20 ml O2/dl - This is max oxygen carrying capacity - 20 ml O2/dl * 60% saturation = 12 ml O2/dl
Hemoglobin Dissociation Curve • Alveoli • Over wide range hemoglobin will be highly saturated • Example: PO2of 60, saturation is 89% • Tissue uptake • Normal: 5 ml O2 /100 ml blood (40 mmHg) • Exercise: 15 ml O2 /100 ml blood (20 mmHg)
Increased Blood Flow to Tissue • Normal blood flow • 20 ml O2/ 100 ml blood * 5000 ml blood/min 1000 ml O2/min • Increased blood flow • 20 ml O2/ 100 ml blood * 20000 ml blood/min 4000 ml O2/min
Carbon Monoxide Dissociation Curve 120 100 80 Per cent Saturation 60 40 20 0 0.0 0.4 PCO
Transport of Carbon Dioxide from Tissue Hgb. CO2 Hgb carbonic anhydrase CO2 H2O +CO2 H2 CO3 HCO3- + H+ H++Hgb- HHgb CO2 Cl- HCO3-
Venous 52 vol% Arterial 48 vol% Carbon Dioxide Dissociation Curve 80 70 60 in blood volumes % 50 40 30 20 2 10 CO 0 0 20 40 60 80 100 120 P CO 2