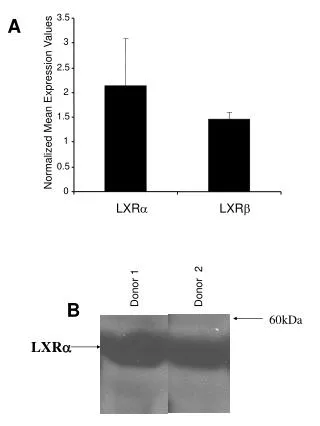
Extended Lifespan in Yeast by Targeted Gene Deletions: Analysis of Conserved Aging Genes
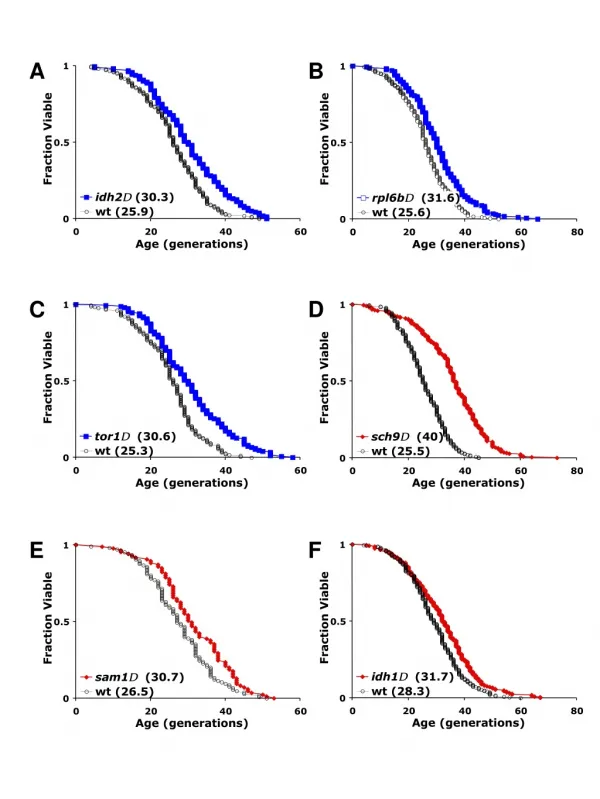
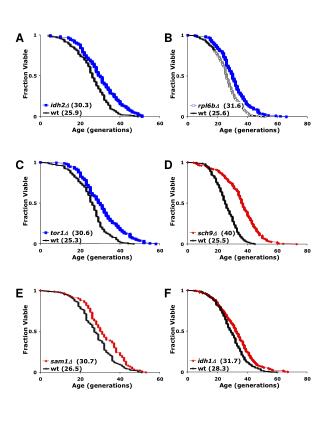
This study examines the impact of specific gene deletions on the replicative lifespan of yeast, focusing on conserved aging genes. Data presented includes mortality curves for each gene deletion, indicating significant lifespan extension when deleting certain genes, such as IDH2 and RPL6B. The findings highlight variations in viability fractions across different deletions and age generations, emphasizing the potential of genetic manipulation in aging research. This work contributes to understanding the genetic basis of lifespan regulation and offers insights for future studies in longevity.

Extended Lifespan in Yeast by Targeted Gene Deletions: Analysis of Conserved Aging Genes
E N D
Presentation Transcript
1 Fraction Viable 0.5 rpl6bD (31.6) 0 0 20 40 60 80 Age (generations) A B 1 Fraction Viable 0.5 idh2D (30.3) wt (25.9) wt (25.6) 0 0 20 40 60 Age (generations) C D 1 1 Fraction Viable Fraction Viable 0.5 0.5 tor1D (30.6) sch9D (40) wt (25.3) wt (25.5) 0 0 0 20 40 60 0 20 40 60 80 Age (generations) Age (generations) E F 1 1 Fraction Viable Fraction Viable 0.5 0.5 idh1D (31.7) sam1D (30.7) wt (28.3) wt (26.5) 0 0 0 20 40 60 80 0 20 40 60 Age (generations) Age (generations)
G H 1 1 Fraction Viable Fraction Viable 0.5 0.5 ypt6D (32.2) inp51D (31.8) wt (27.0) wt (28.5) 0 0 0 20 40 60 80 0 20 40 60 Age (generations) Age (generations) I J 1 1 Fraction Viable Fraction Viable 0.5 0.5 pkh2D (32.1) hse1D (30.5) wt (27.2) wt (25.5) 0 0 0 20 40 60 80 0 20 40 60 Age (generations) Age (generations) K L 1 1 Fraction Viable Fraction Viable 0.5 0.5 pmr1D (34.2) adh1D (33.1) wt (27.4) wt (27.8) 0 0 0 20 40 60 80 0 20 40 60 80 Age (generations) Age (generations)
M N 1 1 Fraction Viable Fraction Viable 0.5 0.5 ygr130cD (30.7) dbp3D (31.5) wt (24.5) wt (24.7) 0 0 0 20 40 60 0 20 40 60 Age (generations) Age (generations) O P 1 1 Fraction Viable Fraction Viable 0.5 0.5 alg12D (31.9) tis11D (32.4) wt (25.7) wt (25.2) 0 0 0 20 40 60 0 20 40 60 Age (generations) Age (generations) Q 1 Fraction Viable 0.5 sis2D (36.2) wt (26.5) 0 0 20 40 60 80 Age (generations)
Figure S1. Mortality curves for conserved aging genes. Replicative life span is significantly extended by deletion of IDH2 (A), RPL6B (B), TOR1 (C), SCH9 (D), SAM1 (E), IDH1 (F), INP51 (G), YPT6 (H), HSE1 (I), PKH2 (J), PMR1 (K), ADH1 (L), YGR130C (M), DBP3 (N), ALG12 (O), TIS11 (P), and SIS2 (Q). Mortality curves for the other conserved aging genes are shown in Figure 1. Curves shown in blue indicate deletion of a gene in the RBH set, while those shown in red indicate deletion of a gene in the RP set. Life span data from both mating types was combined to generate these mortality curves. Mean life spans are given in parentheses in the key of each panel.