Density and Stocking
Density and Stocking. Density and Stocking. Potential of the land to produce wood is determined mainly by its site quality . The actual production or growth of wood fiber achieved on a given site is determined by the number, distribution and species of trees on the site.

Density and Stocking
E N D
Presentation Transcript
Density and Stocking • Potential of the land to produce wood is determined mainly by its site quality. • The actual production or growth of wood fiber achieved on a given site is determined by the number, distribution and species of trees on the site. • Two measures of the number and distribution of trees on a given site are "density" and "stocking". • Density is a measurable "fact". • Stocking is a "relative" assessment.
Measures of Stand Density • 1. Number of trees per acre • 2. Basal area per acre • 3. Stand Density Index • 4. Crown Competition Factor
Stand Density Index • Based on the observed maximum size-density relationship, using • 1) number of trees per acre (TPA) and • 2) mean quadratic tree diameter (Dq), a.k.a. • diameter for tree of mean basal area • Incorporates both number and basal area per acre measurements
Stand Density Index Slope ~ -3/2
Stand Density Index • Equates observed Dq and TPA to an equivalent TPA for the indexed Dq=10 in.
Crown Competition Factor • Reflects the area available to the average tree relative to the maximum area it uses if it were open-grown
Crown Competition Factor CCF < 100
Crown Competition Factor CCF > 150
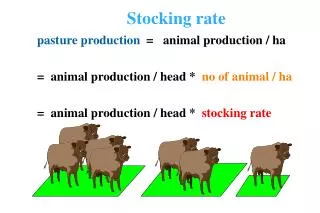
Stocking • Involves the comparison of a given stand to a "normal", or fully-stocked stand. • Problem: "Has anyone ever seen a normal stand?" • Assumes that "natural" mortality is solely a result of over-stocking. • Concept of stocking is very subjective in nature. • Stocking guides are the main method for assessing stocking.
Stocking • 1) Stocking Guides • 2) Stand Density Management Diagrams
1. Stocking Guides • 1. Species Specific • 2. Require that you know trees per acre and basal area per acre. • 3. Usually have 2 or 3 lines that are important: the A-line, the B-line, and sometimes the C-line. • Above the A-line: overstocked • Between A-line & B-line: fully stocked • Below the B-line: understocked • C-line: lower limit of “understocking” to reach the B-line in 10 years on an average stand
2. Stand Density Management Diagrams • What are they? • Graphic tools which illustrate how DIAMETER, HEIGHT, DENSITY and VOLUME change over time for pure, even-aged stands • Why use them? • Lead to understanding of stand dynamics • To plan/evaluate initial spacing and thinning regimes
9th re-measurement 2nd re-measurement 1st re-measurement Baseline measurement
Stands under-stocked Zone of OptimumDensity Management Zone of ImminentCompetition Mortality Maximum size-density line Mortality initiation line Crown closure line Stand trajectories