
100
Supplement Fig 1. Hwang et al. 180. 160. 140. 120. 100. IgE (ng/ml).

100
E N D
Presentation Transcript
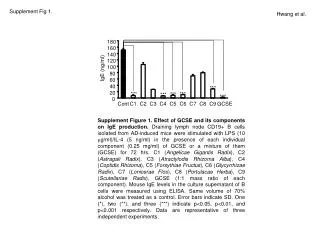
Supplement Fig 1. Hwang et al. 180 160 140 120 100 IgE (ng/ml) Supplement Figure 1. Effect of GCSE and its components on IgE production. Draining lymph node CD19+ B cells isolated from AD-induced mice were stimulated with LPS (10 mg/ml)/IL-4 (5 ng/ml) in the presence of each individual component (0.25 mg/ml) of GCSE or a mixture of them (GCSE) for 72 hrs. C1 (Angelicae Gigantis Radix), C2 (Astragali Radix), C3 (AtractylodisRhizoma Alba), C4 (CoptidisRhizoma), C5 (Forsythiae Fructus), C6 (Glycyrrhizae Radix), C7 (LoniceraeFlos), C8 (PortulacaeHerba), C9 (Scutellariae Radix), GCSE (1:1 mass ratio of each component). Mouse IgE levels in the culture supernatant of B cells were measured using ELISA. Same volume of 70% alcohol was treated as a control. Error bars indicate SD. One (*), two (**), and three (***) indicate p<0.05, p<0.01, and p<0.001 respectively. Data are representative of three independent experiments. 80 60 *** *** *** *** *** 40 *** 20 0 Cont C1 C2 C3 C4 C5 C6 C7 C8 C9 GCSE
Supplement Fig 2. Hwang et al. B A ** 1.2 2.5 1.8 1.6 1 ** 2 * 1.4 ** C * 0.8 ** ** *** 1.2 *** 1.5 *** Supplement Figure 2. Inhibitory effect of GCSE on cytokine production. Draining lymph node CD4+ T cells from AD-induced mice were stimulated with PMA (50 ng/ml)/ionomycin (1 mM) in the presence of each individual component of GCSE or a mixture of them (GCSE; 0.25 mg/ml) for 4 hrs. Relative expression levels of IL-4 (A), IL-5 (B), and IFN-g (C) of single extract treated samples were compared with control samples by qRT-PCR. Expression level of HPRT was used as an internal control. Error bars indicate SD. One (*), two (**), and three (***) indicate p<0.05, p<0.01, and p<0.001 respectively. Data are representative of three independent experiments. Relative IL-5 expression Relative IFN-gexpression 1 0.6 * Relative IL-4 expression 1 0.8 0.4 * *** *** 0.6 *** ** ** *** 0.5 ** ** *** 0.4 *** 0.2 *** *** *** 0.2 0 0 0 C1 C2 C3 C4 C5 C6 C7 C8 C9 GCSE Cont C1 C2 C3 C4 C5 C6 C7 C8 C9 GCSE Cont C1 C2 C3 C4 C5 C6 C7 C8 C9 GCSE Cont
Supplement Fig 3. Hwang et al. A B 70 Normal 30 AD ** 60 Normal * ** 25 AD 50 20 IgE (ng/ml) 40 * Relative cytokine expression 15 30 Supplement Figure 3. Characteristics of CD4+ T cells and CD19+ B cells from normal and AD induced mice. (A) Draining lymph node CD4+ T cells from normal mice or AD-induced mice were stimulated with PMA (50 ng/ml)/ionomycin (1 mM) for 4 hrs. Relative expression levels of IL-4, IL-5, IL-13, and IFN-gin CD4+ T cells from AD-induced mice were compared to cytokine expression in CD4+ T cells from normal mice by qRT-PCR. Expression level of HPRT was used as an internal control. (B) Draining lymph node CD19+ B cells isolated from normal mice or AD-induced mice were either unstimulated (w/o) or stimulated with LPS (10 mg/ml)/IL-4 (5 ng/ml) for 72 hrs. Mouse IgE levels in the culture supernatant of B cells were measured using ELISA. Error bars indicate SD. One (*), two (**), and three (***) indicate p<0.05, p<0.01, and p<0.001 respectively. Data are representative of three independent experiments. *** 10 20 ** 5 10 0 0 w/o LPS/IL-4 IL-4 IL-5 IL-13 IFN-g


